- SPX Monitoring purposes; Long SPX 5/31/19 at 2752.06.
- Monitoring purposes Gold: Long VanEck Vectors Gold Miners ETF (NYSE:GDX) on 1/29/19 at 21.96.
- Long-term Trend SPX monitor purposes; Sold long SPX on 5/6/19 at 2932.61= gain 5.96%:
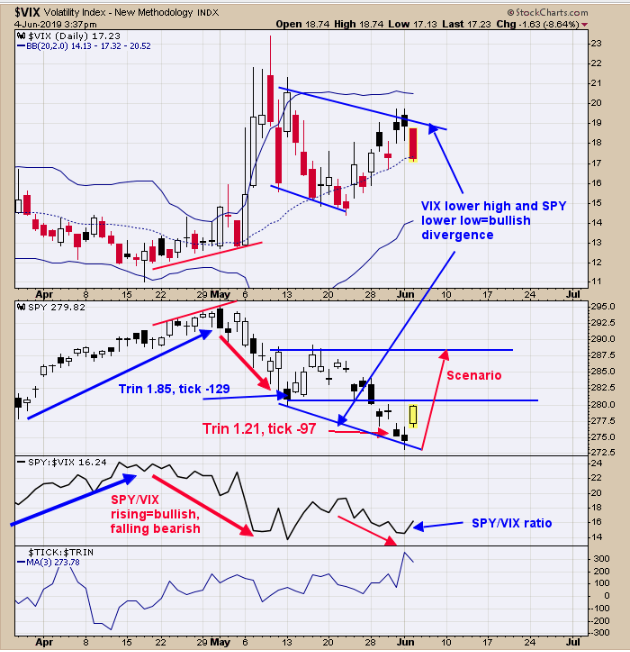
We updated this chart from yesterday. Second window up from the bottom is the SPY/VIX ratio. Near lows in the SPY (NYSE:SPY) the SPY/VIX ratio will trend sideways if not turn up. Yesterday the SPY/VIX ratio at least turned sideways and a bullish sign; and today it rallied. On Friday the Trin closed at 1.21 and the Ticks closed at -97 and a short term bullish combination. This bullish combination can lead a low by a couple of days and looking back the low in the SPY came yesterday. On a bigger timeframe, the SPY has hit lower lows as VIX has made lower highs and a bullish divergence suggesting at some point the SPY will hit a higher high above the May high. SPY could find resistance near the mid May high near 288 (2880 SPX). However this high may only be temporary before moving higher into option expiration week of June 21. Long SPX on 5/31/19 at 2752.06. Join us on twitter. @OrdOracle.
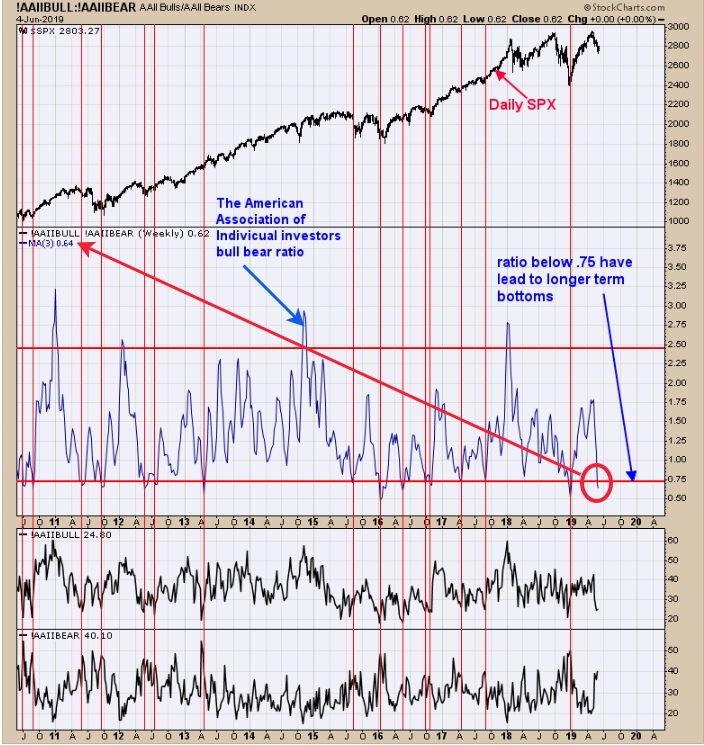
Above is an interesting chart which is the weekly “The American Association of individual investors bull bear ratio” with a three period moving average. When this ratio reaches below .75 (current reading is .64) the market is near an intermediate term low. This chart suggests that the current rally is not a bounce in a downtrend but rather a rally that can last a month or longer. There is a possibility that the current rally could go back and test the May high. Follow us on twitter. @OrdOracle
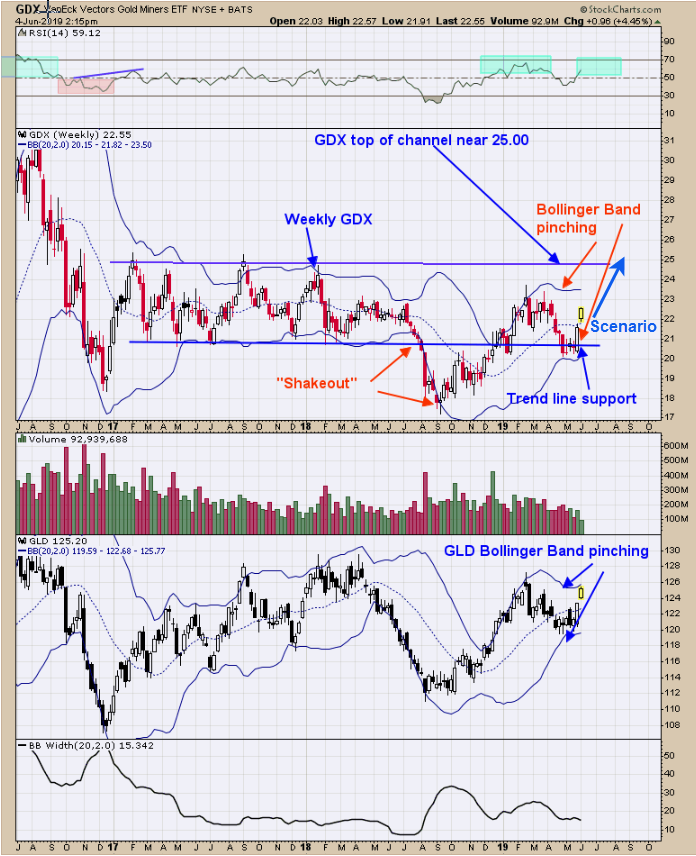
Above is the weekly GDX chart going back to mid 2016. The second window up from the bottom is the weekly GLD (ETF for Gold). The Bollinger band started to “pinch” in May suggesting a large move was not far off. It appears now that the “large move” is beginning. On Yesterday’s report we said that Gold (GLD) may get stronger as the Neckline of a Head and Shoulders bottom needs a “SOS” (sign of Strength) through this level to confirm the Head and Shoulders bottom. If Gold gets stronger than GDX should be even stronger as Gold Stocks outperforms gold in bullish trends and the reason why GDX/GLD ratio rises in bull trends. GDX held near 20.50 support which was the 2017 lows. GDX may now rally to the top of the 2017 trading range which is near 25.00. Ideally we would like to see the 25.00 range broken and continue higher which is possible. In general we expect the current rally to continue into the September October timeframe. Long GDX on 1/29/19 at 21.97. ord-oracle.com. New Book release "The Secret Science of Price and Volume" by Timothy Ord.


