Last Friday, the S&P 500 closed below its 50-day moving average. Theoretically, such a close should have sent traders scrambling for cover Monday morning. As I noted in this past weekend’s missive:
“While the long-term picture still clearly suggests a high level of risk aversion, short-term dynamics have improved which led to a small increase in equity exposure several weeks ago. As shown below, the market has continued to defend the 50-day moving average of the last week while in a corrective process, until Friday.”
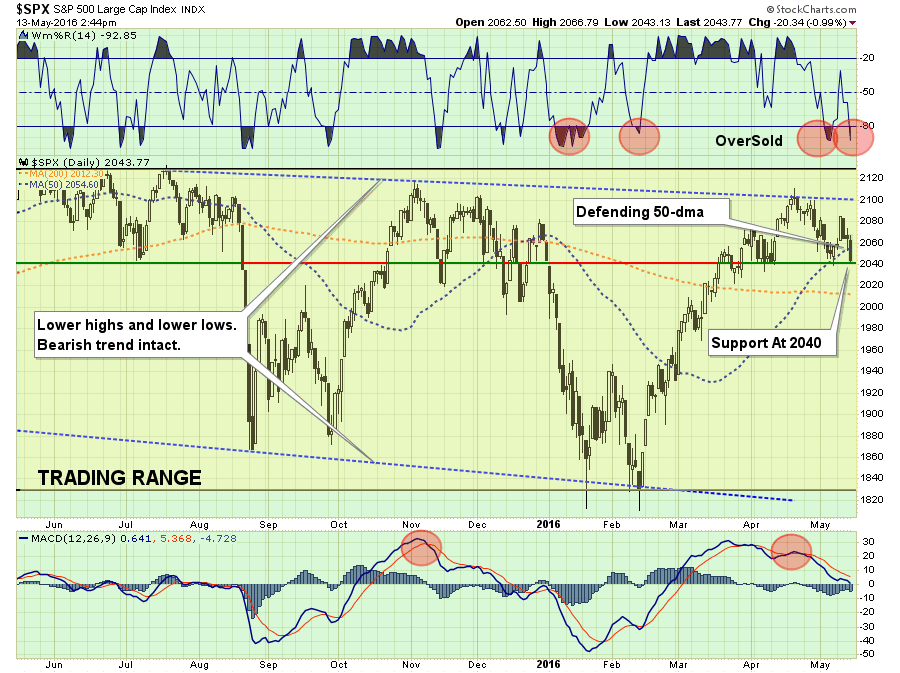
“While the market did violate the 50-dma on Friday, the market held support at recent bottoms. Critically, there is a“head and shoulders” process being formed and the 2040 level is the neckline support of that pattern. A break of that neckline will lead to a more substantial correction process.”
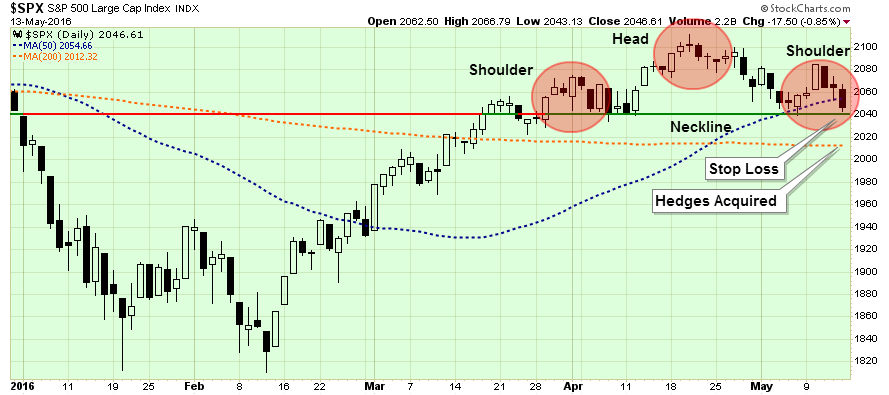
“With the 50-dma trending positively above the 200-dma, we do want to give the markets the benefit of the doubt currently, but I am not dismissing my sense of caution.”
Yesterday, support at 2040 was defended as the markets turned sharply higher amidst continued poor economic data releases. For now the bull’s clearly remain in charge, but the question is for how long?
As we head into the summer months, I am becoming more concerned about a correction against the backdrop of historical tendencies, continued poor economic and fundamental data, a presidential election year, and continued weak technical structures. Let’s take a look at each of these points.
Historical Tendencies
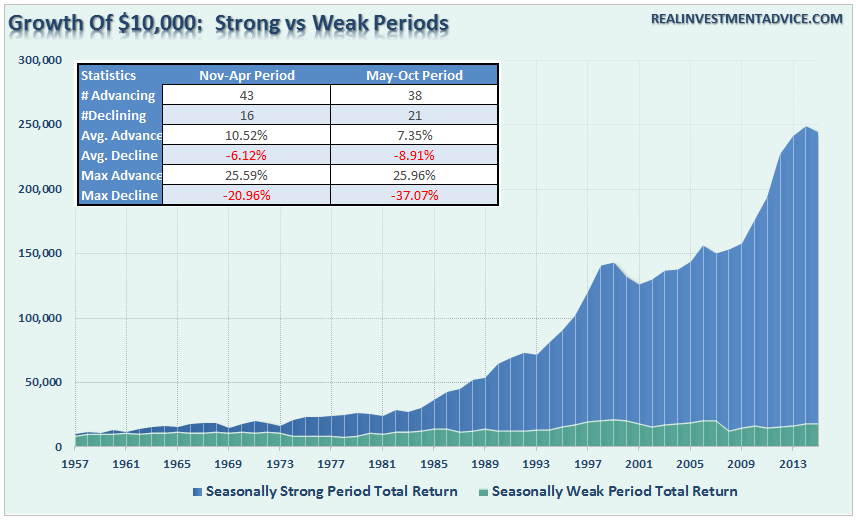
I have written in the past about the historical precedent of “Sell In May And Go Away.” Every year, there is always a litany of articles written about why it is such a bad idea, you need to just “buy and hold”, blah…blah…blah.
Yes, there are years where the markets rise during the summer months, but more importantly, it is those years where that doesn't happen which cause the most damage. Last year, selling in May, as I recommended, saved investors during the August dive.
For a moment, set aside the inherent biases of media and investment firm publications designed to keep you invested at all times so they can collect a fee or ad revenues. Instead, let’s discuss the “Sell In May” issue from a more technical and statistical basis.
First, “selling in May” does not necessarily mean going to cash. Can we please stop using extremes to try and prove a point?
“Selling In May,” at least in my world, is the process of reducing risk during a period of time where historical returns have tended to be poor. Take a look at the chart below which shows a $10,000 investment into markets during the“Seasonally Strong” vs. “Seasonally Weak” periods. Did you really miss anything by skipping the summer months?
Economic And Fundamental Backdrop Remains Weak
As I showed at length yesterday, the economic backdrop continues to remain extremely weak. This leaves the markets vulnerable to an exogenous event this summer that could again derail expectations of both an economic and earnings related recovery.
The chart below shows trailing reported earnings so far and forward estimates. Importantly, notice the deterioration in estimates not only from last March to current, but also the two months between March and May of 2016.
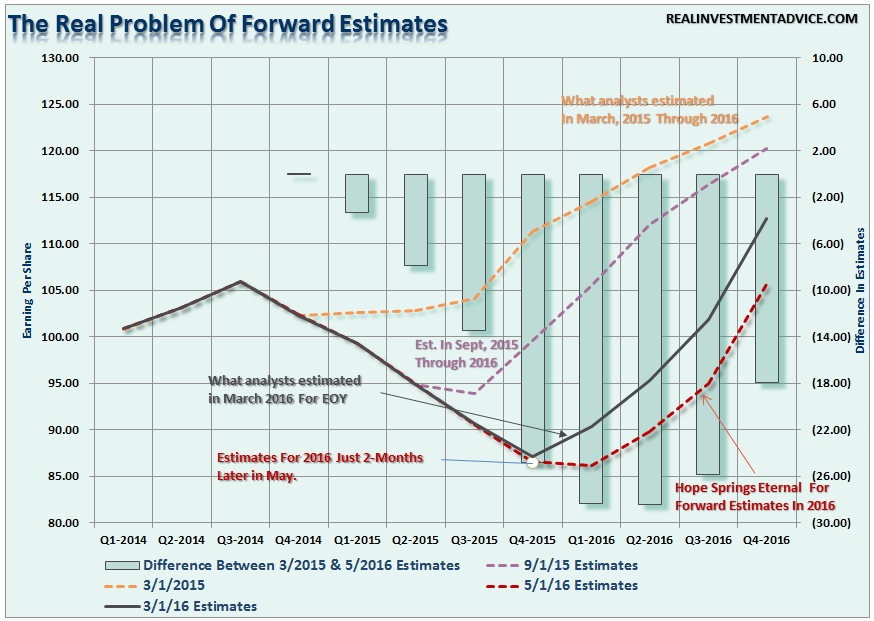
The deterioration in estimates is why there is ALWAYS a high “beat” rate in bottom line earnings per share. As an investor, using “using forward” estimates to justify “valuation” is a highly dubious endeavor given the extremely high fallibility in the estimates being used. In other words, what appeared to be “cheap” in March of 2015, is hardly such a “value proposition” today.
The weak earnings environment today is more than just a strong dollar or weak oil prices. While not wholly recognized as of yet, the reality is that previous measures of boosting earnings per share through cost-cutting, wage suppression and share buybacks to offset weak revenue growth have likely reached their limits.
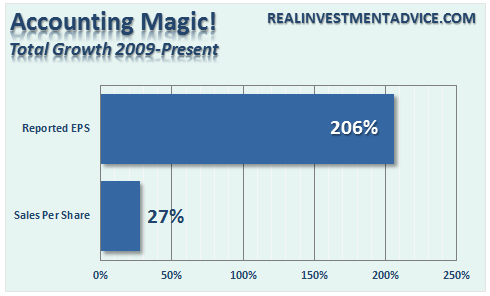
Importantly, share buybacks have been a major support for asset prices in recent years and that support looks to have ended for now. As Lu Wang recently reported:
“Announced repurchases dropped 38 percent to $244 billion in the last four months, the biggest decline since 2009, data compiled by Birinyi Associates and Bloomberg show.”
This also leaves stocks, currently at very elevated levels, at risk of further downside if further earnings deterioration arises.
Presidential Election Years
The months leading up to a Presidential election have historically also not been kind to investors. As shown in the chart below, the summer months leading up to the election have, on average, witnessed both greater volatility and low to negative returns.
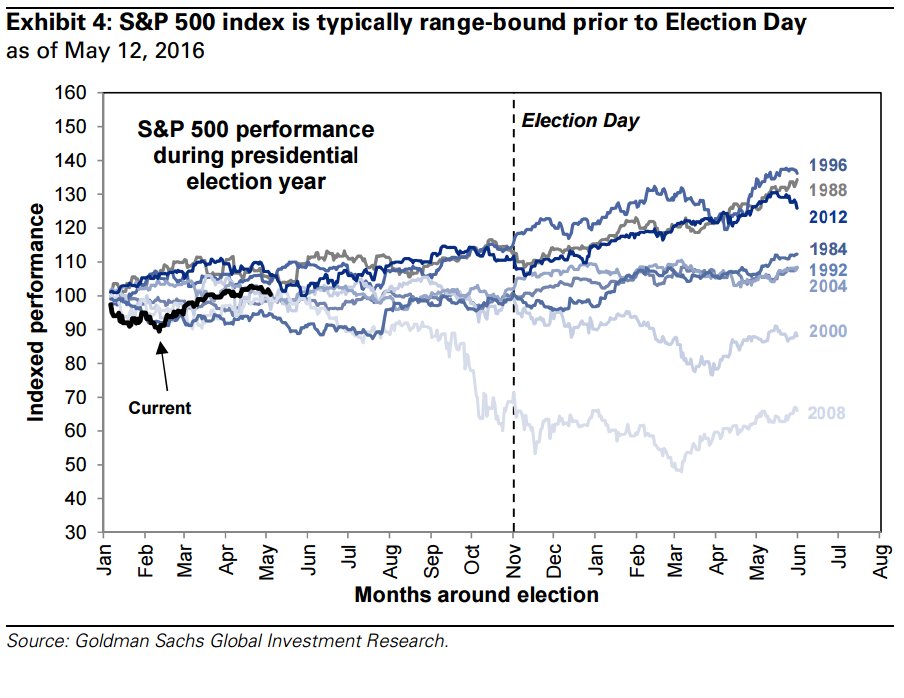
As recently discussed by William Watts via MarketWatch:
“Brian Belski sees election rhetoric adding ‘another layer of uncertainty’ to the market over the course of the year, contributing to a pullback that will be followed by a recovery later in the year.
In his 2016 outlook, Belski took the data back to 1928. Presidential election years have produced an average S&P 500 annual gain of 7% versus 7.5% for all years, he found. In other words, presidential election years have been pretty average.
But in an interesting wrinkle that Belski finds quite relevant, election years in which a new president must be elected have seen the S&P lose 4% on average.“
Given the current battle between Hillary Clinton and Donald Trump for the oval office, there is a higher degree of uncertainty about what policies may be implemented under the administration. As the election grows closer, and more certainty about who the likely winner will be, concerns over policy changes and outlooks could have a negative impact on the markets.
Technical Weakness
For me, the most important thing right now is the price action of the market. Earnings, economics, fundamentals, policy changes, etc., while important, play out over longer-term time frames. It is really only price, a reflection of short-term market psychology, that is important over the next couple of months.
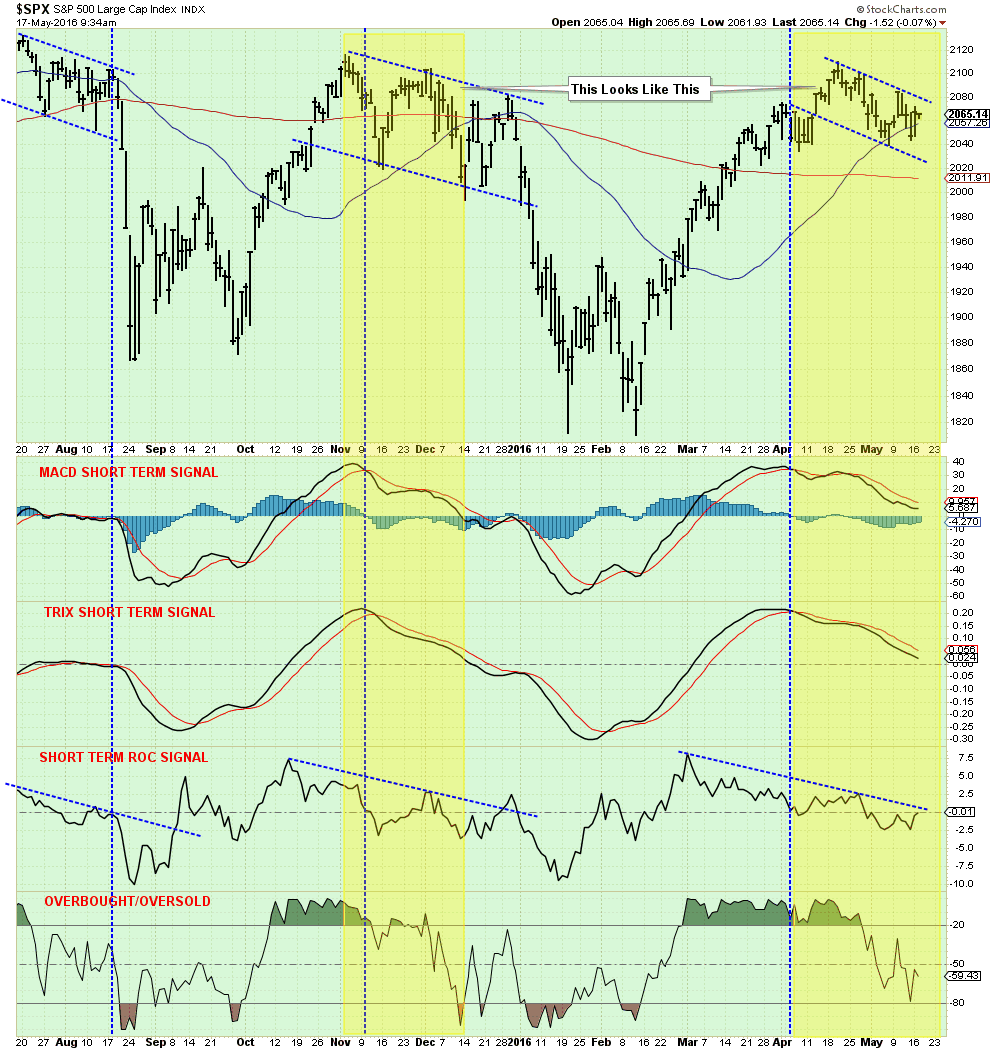
As shown above, the current price action is extremely similar that seen during the topping process in November and December of last year. With all the signals currently deteriorating, the risk to asset prices in the weeks ahead is likely to the downside.
This similarity in action is better witnessed in the chart below.
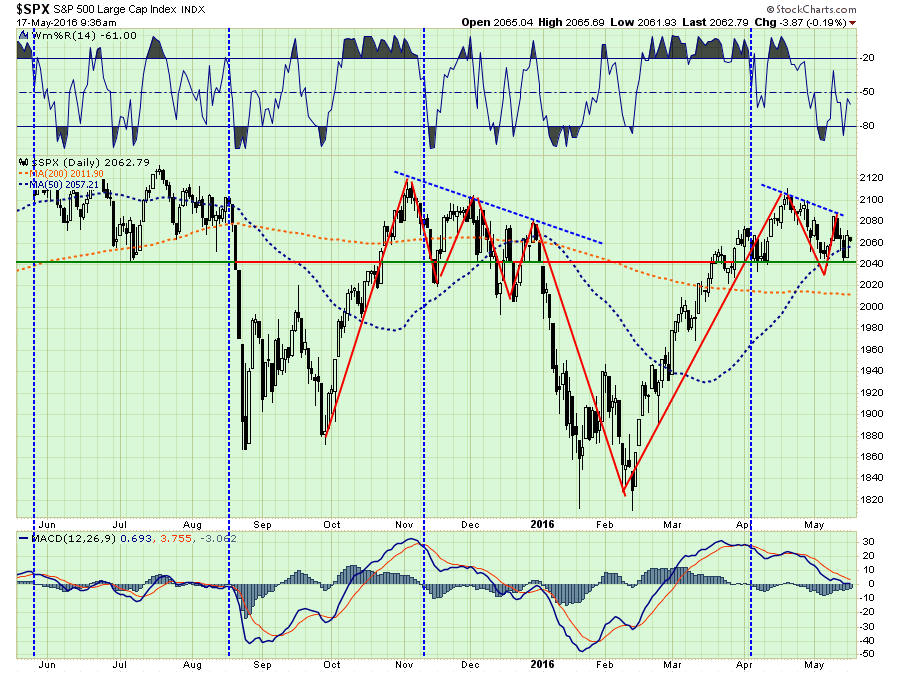
Does this absolutely mean that markets will break to the downside and retest February lows? Of course, not. However, throw into the mix ongoing high-valuations, uncertainty about what actions the Federal Reserve may take, ongoing geopolitical risks, concerns over China, potential for a stronger dollar or further weakness in oil – well, you get the idea. There are plenty of catalysts to push stocks lower during what is typically an already weak period.
Should you “sell in May and go away?” That decision is entirely up to you. There is never certainty in the market, but the deck this summer seems much more stacked than usual for investors who are taking on excessive equity based risk. The question you really need to answer is whether the “reward” is really worth the “risk?”
“There is only one side to the markets; it is not the bull side or the bear side, but the right side.” – Jesse Livermore
