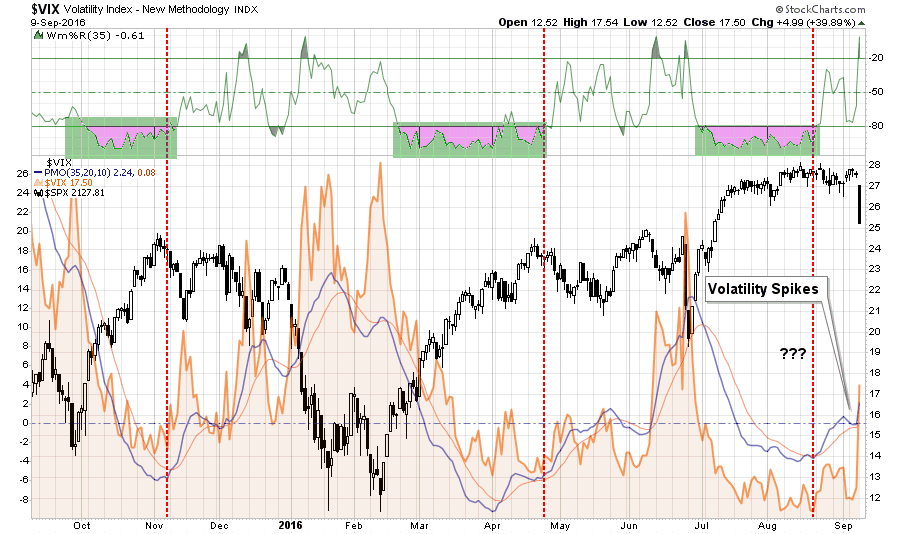
In this past weekend’s newsletter, I discussed the return of volatility to the market:
“While it seemed for a while that volatility had been completely eliminated from the market by an ever present Fed, I warned this was a dangerous assumption to make.
On Friday, volatility returned with a vengeance.”
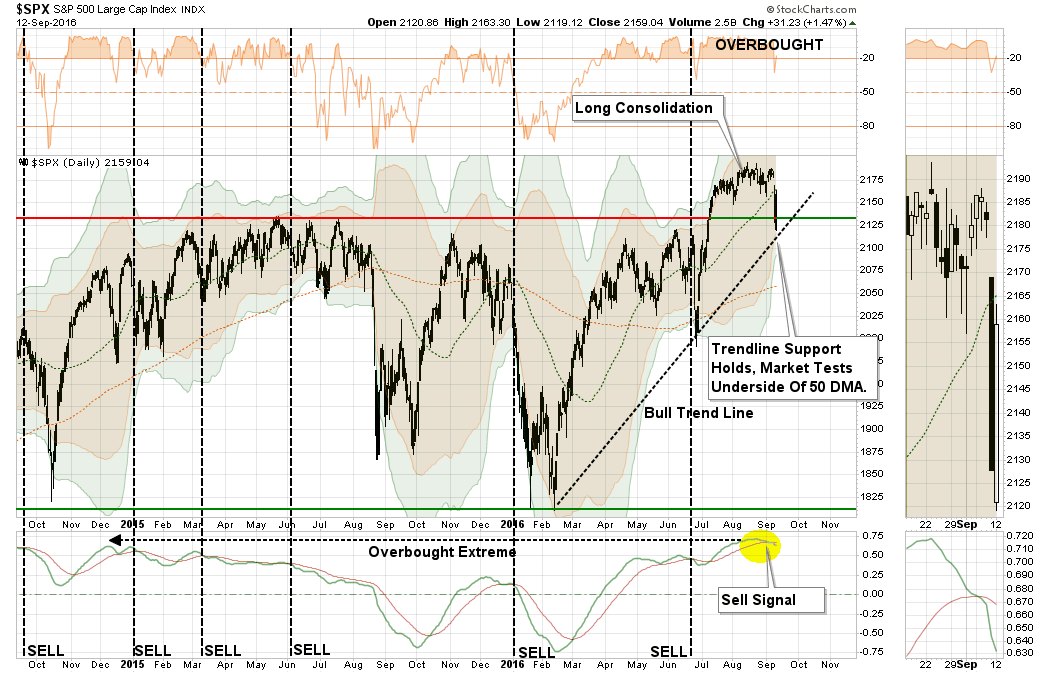
(I closed out my VXX long on Monday which served its purpose of protecting declines in portfolios this past Friday.)“Analysts, the media, and Wall Street talking heads rushed to grab every excuse available to explain the sudden sell-off on Friday from the Fed, ECB, and Japan to interest rates and the dollar. However, the reality is I have been warning about a pending correction over the last month as market extensions had reached extremes.”
Of course, discussing the potential of a market correction is almost always perceived as being “bearish” and by extension must mean that I am either out of the market completely or short the market and have “missed out” on previous advances. This is particularly the case when you have a “round trip” market advance like we did yesterday which leaves investors sitting “flat footed” and unsure about what to do next.
This reminds me of something famed Morgan Stanley) strategist Gerard Minack said once:
“The funny thing is there is a disconnect between what investors are saying and what they are doing. No one thinks all the problems the global financial crisis revealed have been healed. But when you have an equity rally like you’ve seen for the past four or five years, then everybody has had to participate to some extent.
What you’ve had are fully invested bears.”
While the mainstream media continues to misalign individuals expectations by chastising them for “not beating the market,” which is actually impossible to do, the job of a portfolio manager is to participate in the markets with a predilection toward capital preservation. It is the destruction of capital during market declines that have the greatest impact on long-term portfolio performance.
It is from that view, as a portfolio manager, the idea of “fully invested bears” defines the reality of the markets that we live with today. Despite the understanding that the markets are overly bullish, extended and valued, portfolio managers must stay invested or suffer potential “career risk” for underperformance. What the Federal Reserve’s ongoing interventions have done is push portfolio managers to chase performance despite concerns of potential capital loss. We have all become “fully invested bears” as we are all quite aware that this will end badly, but no one is willing to take the risk of being grossly underexposed to Central Bank interventions.
Therefore, as portfolio managers and investors, we must watch the markets carefully for signs that the “worm has turned” and then react accordingly. This is something I cover explicitly each week in my Real Investment Report but wanted to share five charts that I am watching very closely. These charts are all sending an important message, but it is only when the market begins to listen that they will truly matter. But when it happens, the message will matter, and it will matter a lot.
Valuations
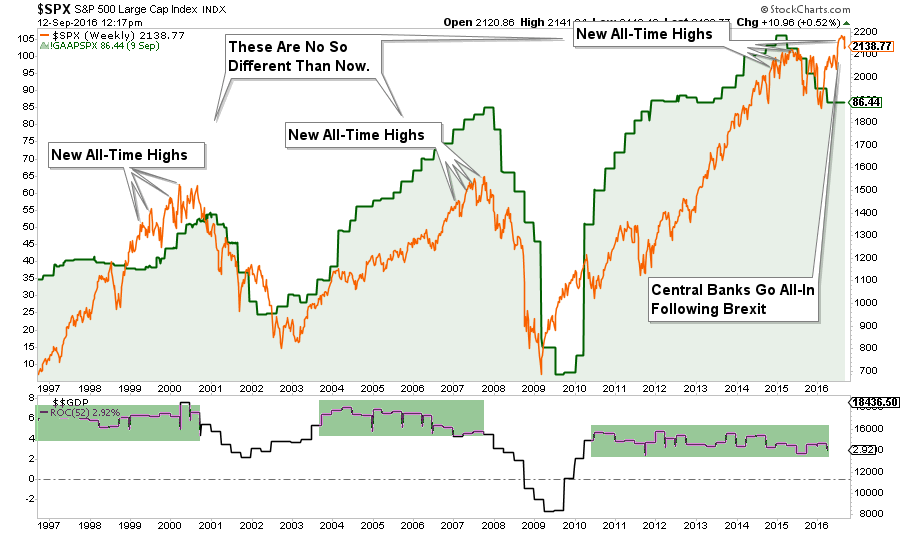
One of the consistent drivers behind the bull market over the last few years has been the idea of the “Fed Put.” As long as the Federal Reserve was there to “bail out” the markets in the event that something went wrong, there was no reason not to be invested in equities. In turn, this has pushed investors to not only “chase yield,” due to artificially suppressed interest rates but to push valuations on stocks back to levels only seen prior to the turn of the century.
According to a recent note from Goldman Sachs:
“Stock valuations remain extended. The S&P 500 trades at the 84th percentile of historical valuation, while the median stock is at the 98th percentile.”
Of course, these valuation extensions are occurring against a backdrop of deteriorating economic growth. The combination of which, as shown in the chart above, has not worked out well for investors in the past.
Junk Bonds
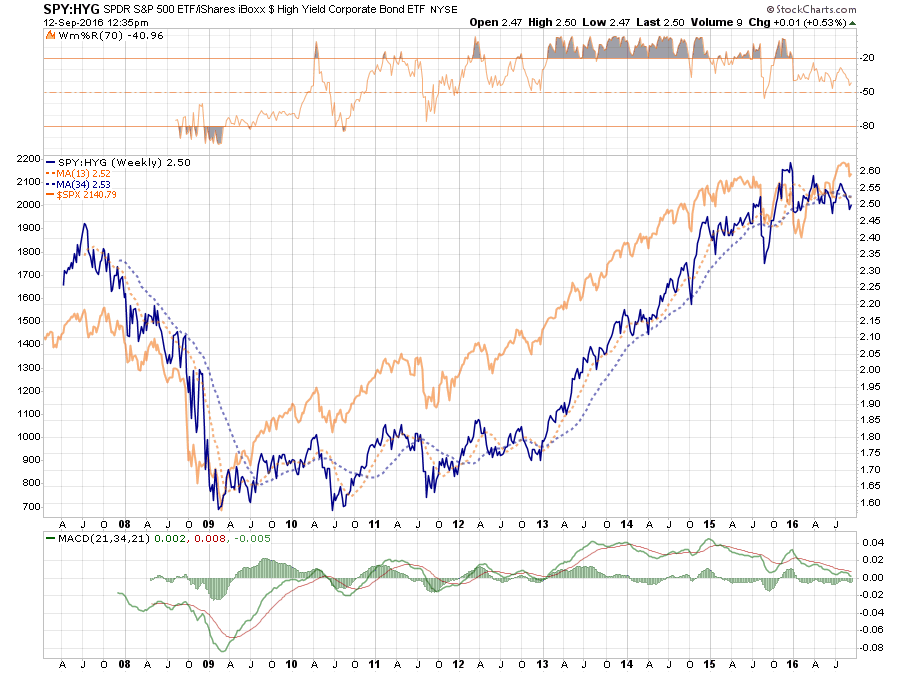
With the Fed standing behind the markets at every turn, and with interest rates plumbing historic lows, investors were emboldened to “chase yield” in the credit markets. While the financial product marketers (pronounced Wall Street) delivered a smorgasbord of “high yield” investments for consumption, many retail investors had very little clue that “high yield” actually meant “junk bonds.” Below, the SPDR S&P 500 ETF (NYSE:SPY):iShares iBoxx $ High Yield Corporate Bond (NYSE:HYG):
With little concern for the additional risk being plowed into portfolios in expectation of greater return, the yields on “junk credits” were pushed to historic lows. However, those yields have begun to rise as of late and historically this has been a sign that the “love affair” with excess risk may be coming to an end. As shown above, the recent deviation between junk bond yields and the S&P 500 has been a warning sign in the past that should be paid attention to.
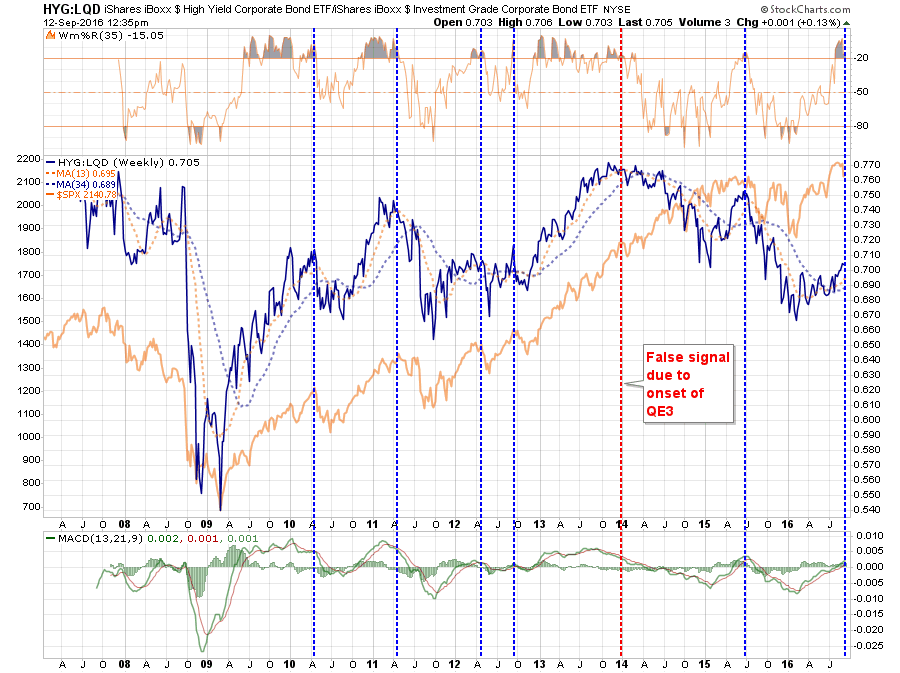
The chart below shows the ratio between high yield credits (via HYG) and government Treasuries iShares iBoxx $ Investment Grade Corporate Bond (NYSE:LQD). When this ratio is rising, and overbought (blue dashed lined) it has generally been near corrective peaks.
Margin Debt
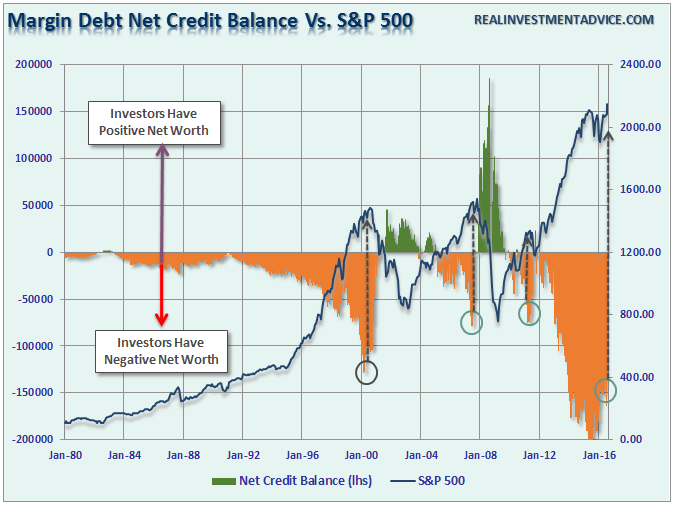
No risk in the markets? Why not double down by leveraging up? Margin debt has recently hit historic highs in the market on a variety of different measures. Importantly, rising margin debt is NOT the problem. The problem comes when the excess leverage is forced to unwind due to rapidly falling asset prices. Margin debt, like gasoline on a fire, amplifies the downturn in stocks as falling prices trigger margin calls which forces more selling. That vicious cycle is what leads to extremely rapid market declines that leave investors watching, paralyzed with fear, as their capital vanishes.
The explosion in margin debt, which has led to historically large credit balances, was seen at both previous market peaks. Could it be different this time? Sure, but if it isn’t, there is plenty of “fuel for the fire” when the next market reversion begins.
Deviation
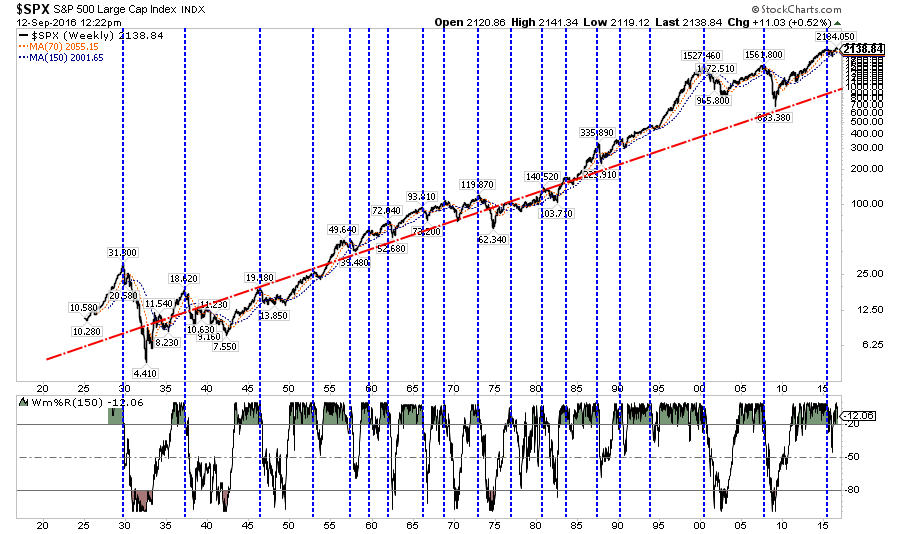
I have written many times in the past that the financial markets are not immune to the laws of physics. What goes up, must and will eventually come down. The example I use most often is the resemblance to “stretching a rubber-band.” Stock prices are tied to their long-term trend which acts as a gravitational pull. When prices deviate too far from the long-term trend they will eventually and inevitably “revert to the mean.”
Currently, that deviation from the long-term mean is at the highest level since the previous two bull-market peaks. Does this mean that the current bull market is over? No. However, it does suggest that the “risk” to investors is currently to the downside and some caution with respect to direct market exposure should be considered.
Sentiment
Lastly, is investor sentiment. When sentiment is heavily skewed toward those willing to “buy,” prices can rise rapidly and seemingly “climb a wall of worry.” However, the problem comes when that sentiment begins to change and those willing to “buy” disappear. It is this “vacuum” of buyers that leads to rapid reductions in prices as sellers are forced to lower their price to complete a transaction. This problem becomes rapidly accelerated as “forced liquidation” due to “margin calls” occur giving what few buyers that remain almost absolute control at what price they will participate. Currently, there is a scarcity of “bears.”
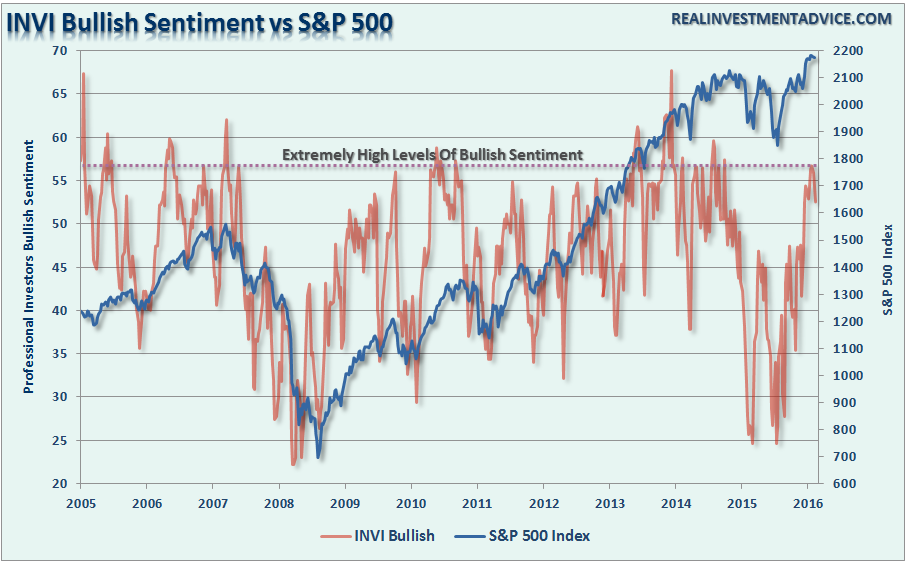
With sentiment currently at very high levels, combined with low volatility and excess margin debt, all the ingredients necessary for a sharp market reversion are currently present. Am I sounding an “alarm bell” and calling for the end of the known world? Should you be buying ammo and food? Of course, not.
However, I am suggesting that remaining fully invested in the financial markets without a thorough understanding of your “risk exposure” will likely not have the desirable end result you have been promised. All of the charts above have linkages to each other, and when one goes, they will all go. So pay attention to the details.
As I stated above, my job is to participate in the markets while keeping a measured approach to capital preservation. Since it is considered “bearish” to point out the potential “risks” that could lead to rapid capital destruction; then I guess you can call me a “bear.” However, just make sure you understand that I am an “almost fully invested bear” for now. But that can, and will, rapidly as the indicators I follow dictate.

