Summary
- The overall index performance for 2018 is bearish.
- With the exception of the utility sector, all industry ETFs are at or near a 52-week low.
- The market is still overvalued.
Normally, at the beginning of this series, I add some commentary about the economy. I'm going to skip that today and simply look at the indexes and industries to see where we're ending the year.
Let's start with a year-end performance of the major indexes:
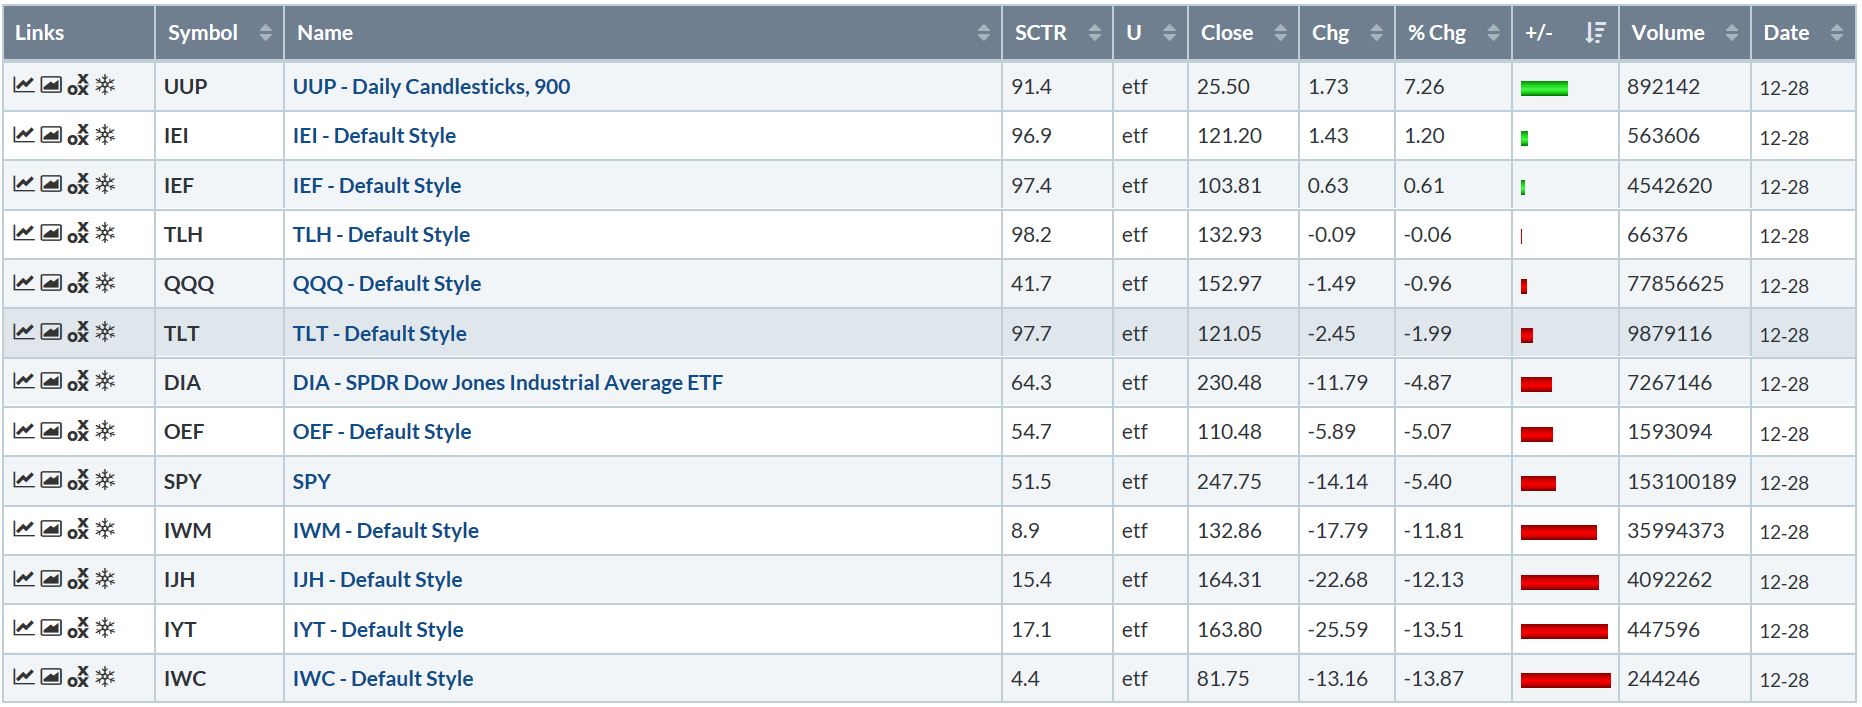
At the top—in positive territory—are the Treasury market ETFs, iShares 3-7 Year Treasury Bond (NASDAQ:IEI), iShares 10-20 Year Treasury Bond (NYSE:TLH) and iShares 20+ Year Treasury Bond (NASDAQ:TLT). The 2-10 year section (the "belly of the curve") was modestly higher. The 10-20 year area was down fractionally, while the long-end of the curve was down 2%.
Then, we have the larger-cap indexes—SPDR Dow Jones Industrial Average (NYSE:DIA), iShares S&P 100 (NYSE:OEF), and SPDR S&P 500 (NYSE:SPY). These were down modestly on the year. The real damage occurred in the mid- and small-caps; mid-caps lost a little more than 12%; small-caps were down about 12%; and micro-caps declined nearly 14%. This table shows that investors are taking a far more conservative orientation to their investments at year-end.
Here is the yearly performance of the major sector ETFs:

The two top performers are defensive issues: Healthcare and Utilities. Consumer Discretionary was up modestly. Then we start to see declines. Technology was down marginally; Real Estate's losses were slightly larger. Energy—which dropped in tandem with oil's fourth-quarter price collapse— was the worst performer. Industrials and Basic Materials (two sectors which are not only early cycle industries but are also disproportionately affected by the trade wars) are the second and third worst performers, respectively.
Next, let's look at the relative strength graph of the major industries:
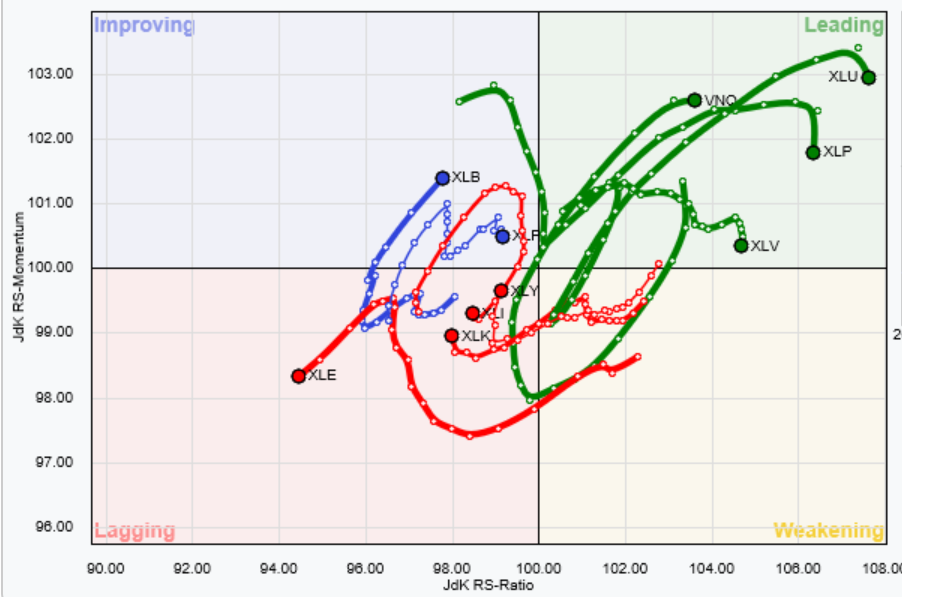
I've used long tails in the analysis. Notice the distinctively defensive nature of the leading and lagging sectors. Utilities, staples, healthcare, and real estate are leading SPY; industrials, technology, discretionary, and energy are lagging. This simply confirms what we've been seeing above: traders and investors are now far more defensive.
Let's dig into the market's internals, starting with the NASDAQ:
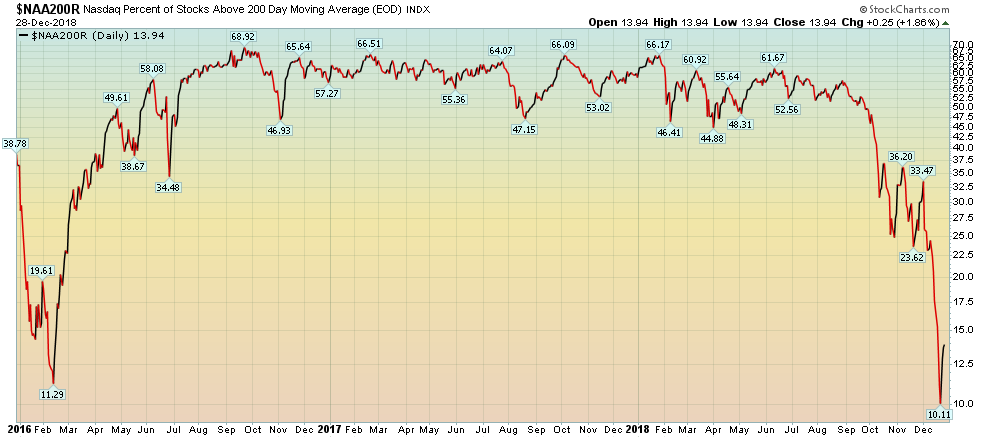
The percentage of stocks above their 200-day EMA is below 15%...
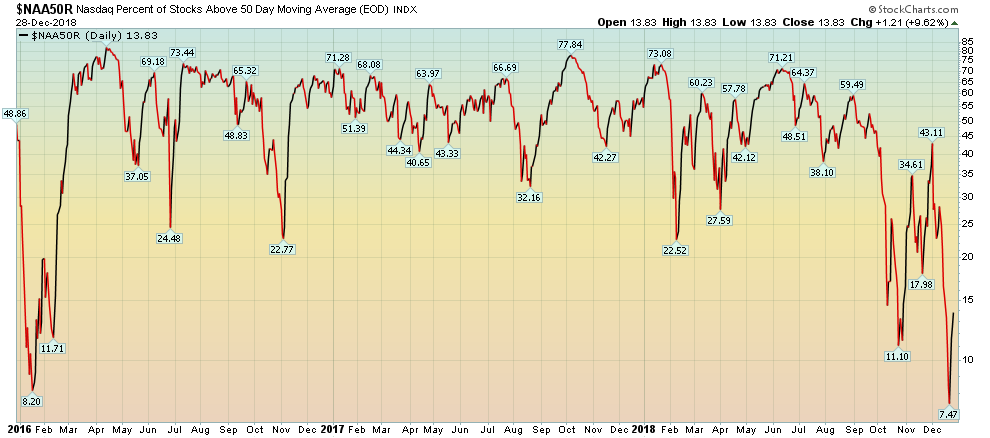
...as is the percent of NASDAQ stocks below their 50-day EMA.
We see similar percentages for the NYSE:
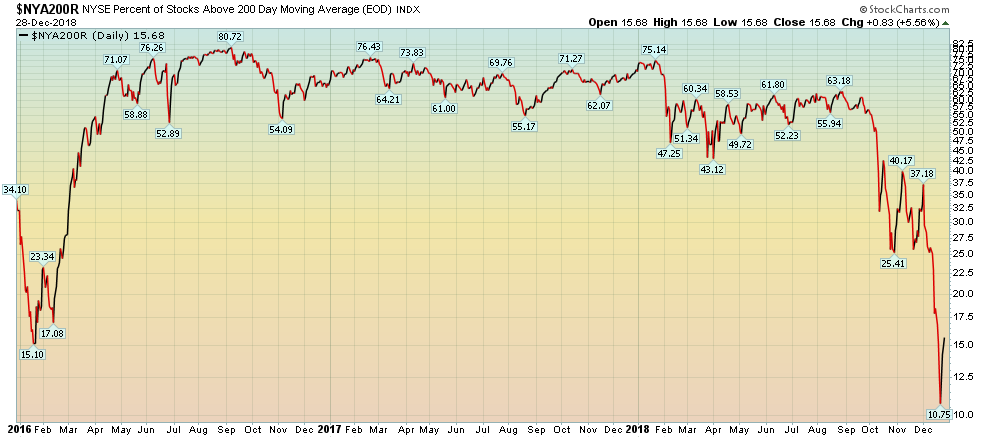
Slightly more than 15% of NYSE stocks are above their 200-day EMA...
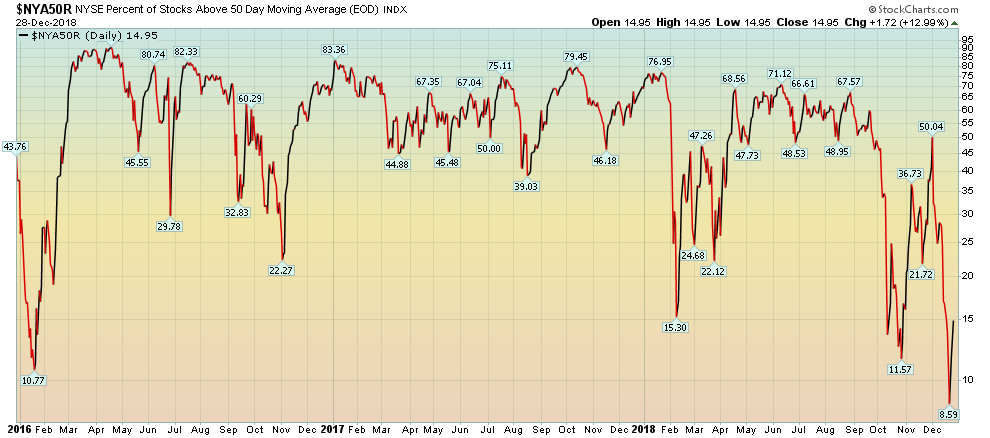
...while slightly less than 15% of stocks are below their 50-day EMAs.
There are several ways to interpret these charts. On one hand, they show a very oversold market. If we were in a bull market, this data would point towards a "buy the dip" recommendation. But if market sentiment is bearish—which we're fast approaching—it could also mean we should expect prices to coalesce at lower levels.
Despite low breadth, the market remains overvalued:
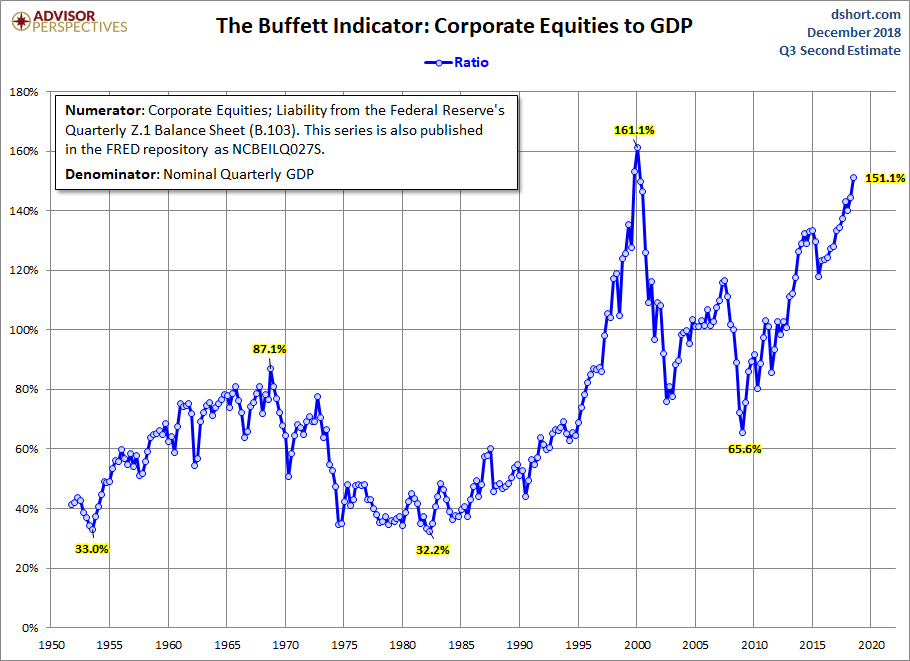
The "Buffett Indicator," which measures the market capitalization of equities relative to GDP, is 10% below its high from the dot.com bubble of the late 1990s.
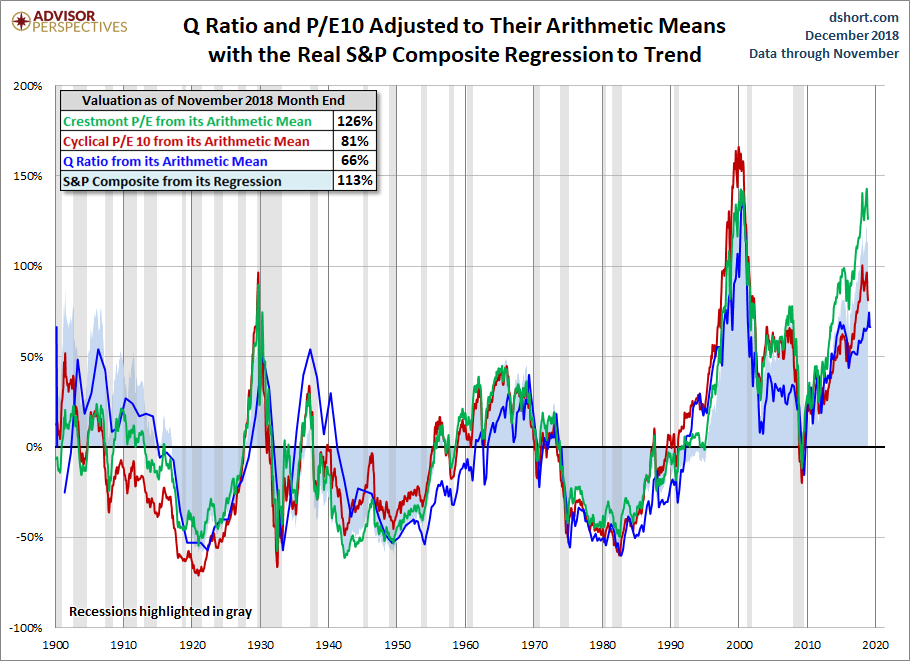
Other measures also show an overvalued market.
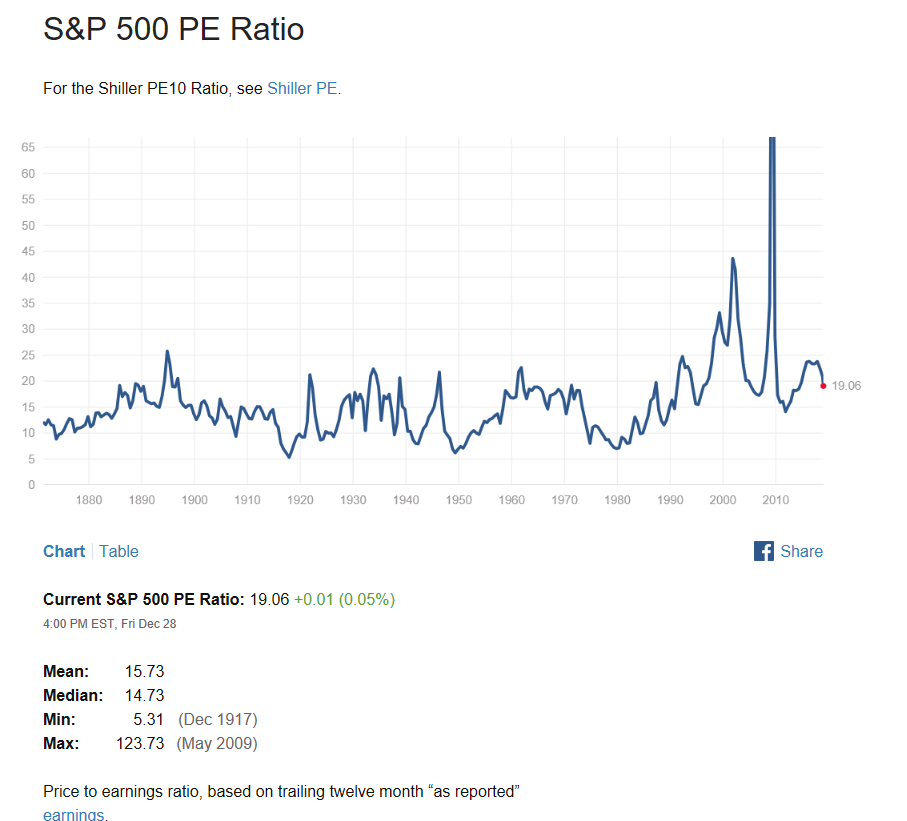
The more traditional PE ratio is a bit lower and closer to historical averages.
So far we've established that the market—while oversold—is still expensive by a number of valuation measures. Let's add a few charts, starting with the weekly iShares Russell 2000 (NYSE:IWM):
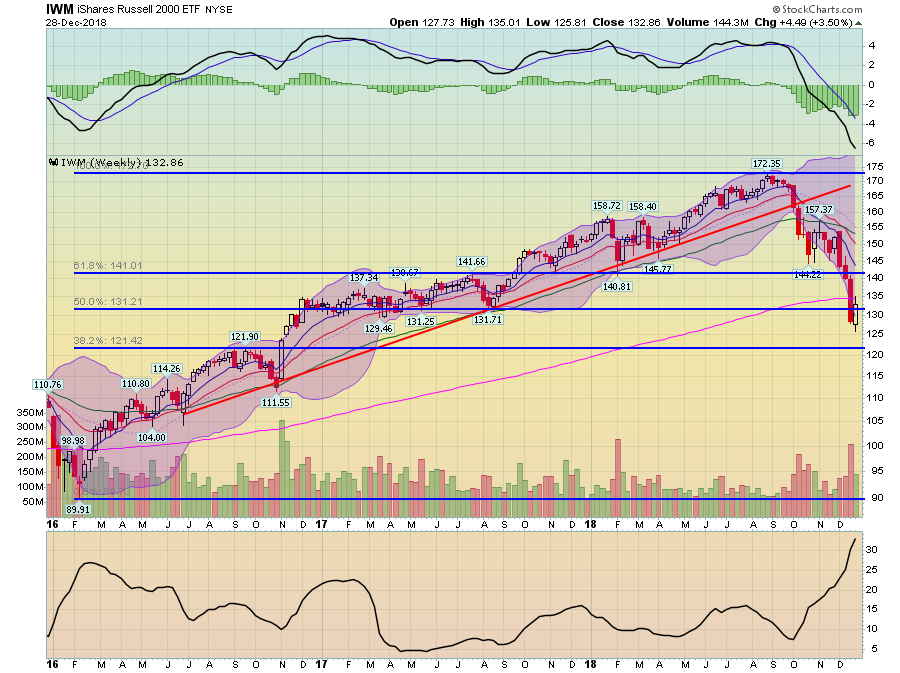
IWM broke long-term support in 2H18. Prices are now below the 200-week EMA and are now resting on the 50% Fib level.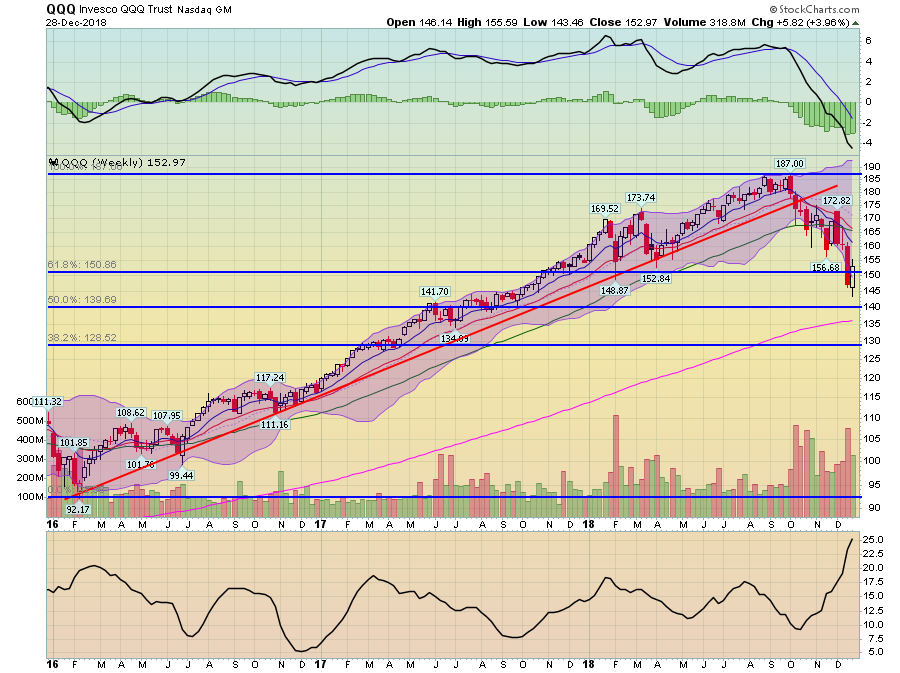
Invesco QQQ Trust Series 1 (NASDAQ:QQQ) has also broken support, but it is about its 200-week EMA. Prices are currently sitting on the 61.8% Fib level. Finally, we have SPY's weekly chart:
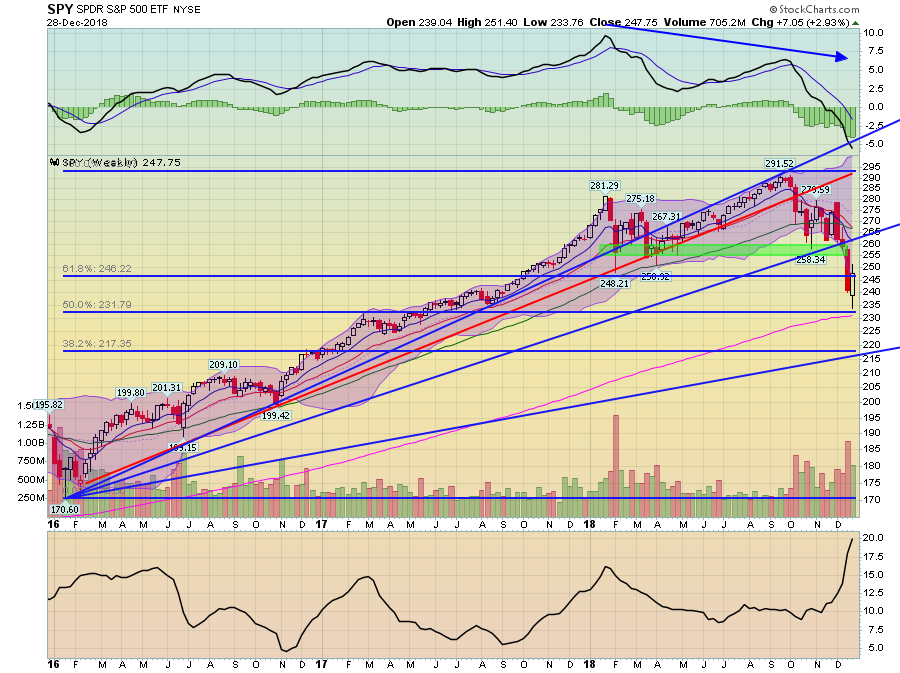
This has much more in common with QQQ. However, the key is that it has still broken support.
Finally, let's toss the yearly sector ETF charts in for good measure:
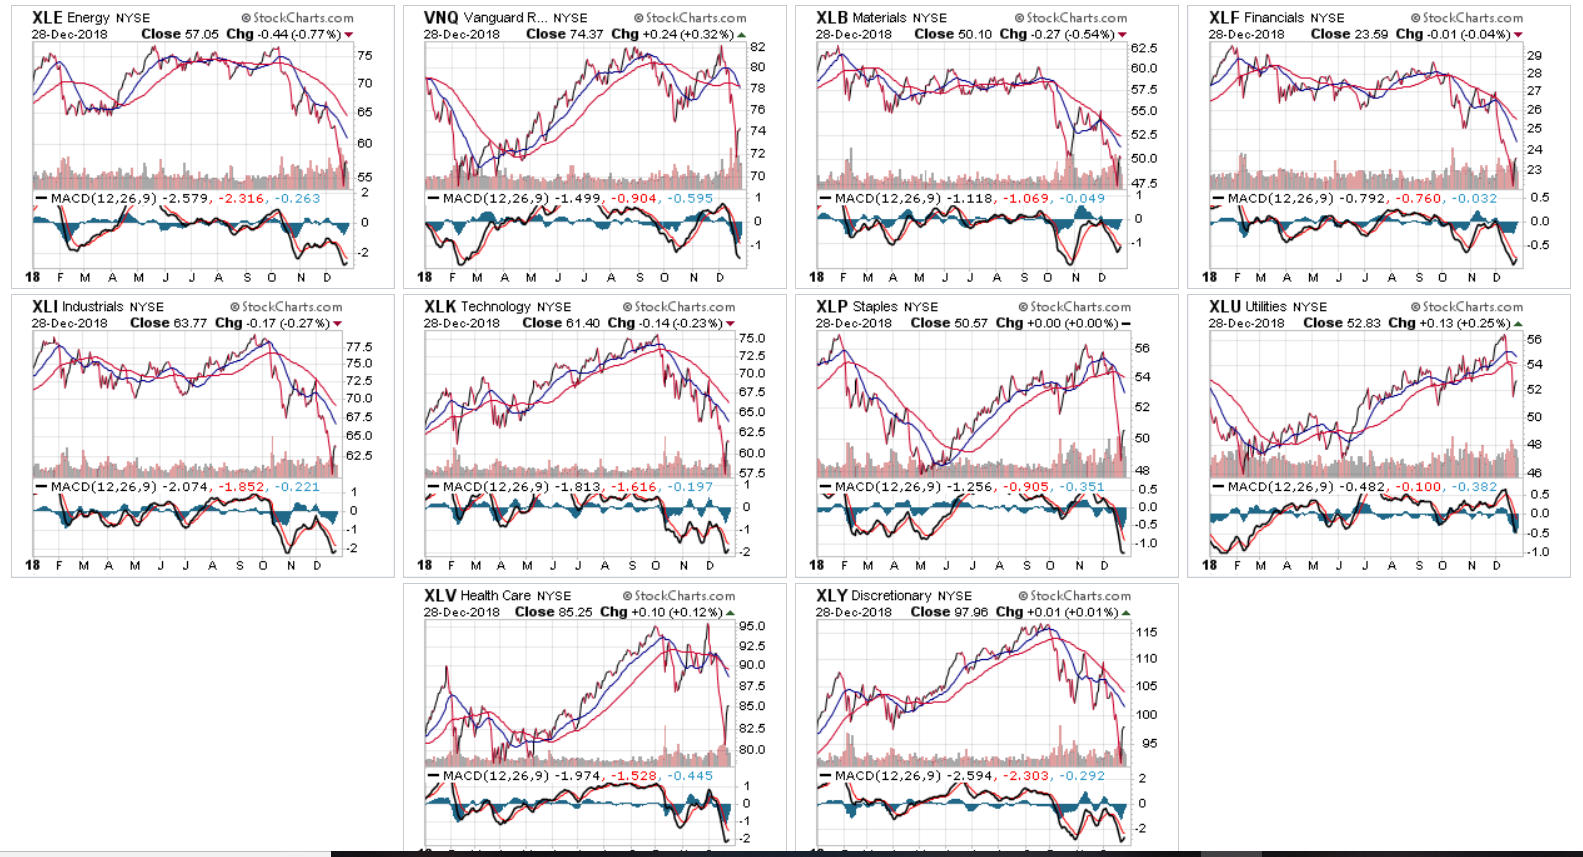
Only one sector, utilities, is in an uptrend. All others are at or near yearly lows. Momentum is weak across the board.
Let's sum up: the market is technically weak. The major averages have broken multi-year trends and are now trying to find technical support at various levels. While breadth is weak, the overall bearish market tone means a strong rebound probably isn't likely. Despite the sell-off in the 2H18, the market is still overvalued, which means we could now be experiencing a return to more "normal" or lower valuations. Finally, with the exception of the utility sector, all the industry sectors are at 52-week lows and in a technically weak position.
Disclosure: I have no positions in any stocks mentioned, and no plans to initiate any positions within the next 72 hours.

