As we start moving into the last two weeks of the trading year, investors everywhere are hopeful that “Santa Claus” will visit “Broad & Wall.”
The actual Wall Street saying is that “If Santa Claus should fail to call, bears may come to Broad & Wall.” The Santa Claus Rally, also known as the December effect, is a term for more frequent than average stock market gains as the year winds down. However, as is always the case with data, average returns are sometimes different than reality.
Stock Trader’s Almanac explored why end-of-year trading has a directional tendency. The Santa Claus indicator is pretty simple. It looks at market performance over a seven day trading period—the last five trading days of the current trading year and the first two trading days of the New Year. The stats are compelling.
The stock market has risen 1.3% on average during the 7 trading days in question since both 1950 and 1969. Over the 7 trading days in question, stock prices have historically risen 76% of the time, which is far more than the average performance over a 7-day period.
As I said, while it is a very high probability that stock prices will climb, there is a not-so-insignificant 24% chance they won’t. Such is why we want to analyze the technical backdrop to minimize the risk of “getting a lump of coal.”
However, let’s first analyze the “Santa Claus Rally.”
The Santa Claus Rally
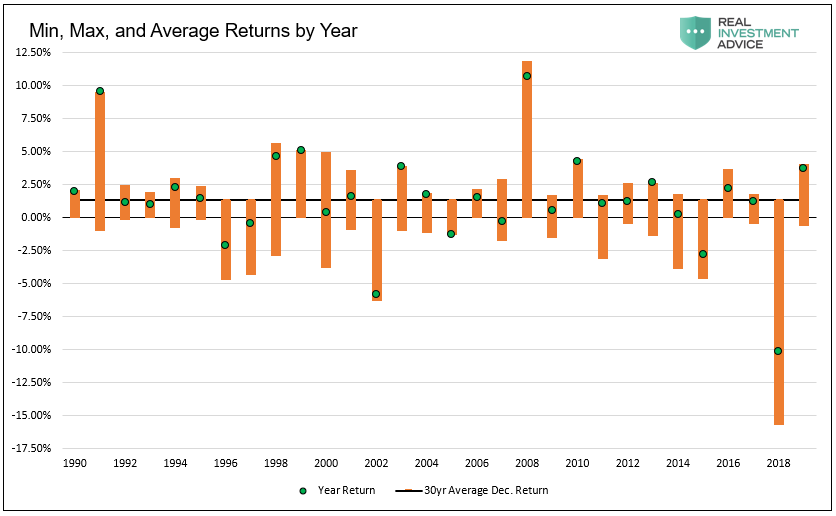
A couple of years ago, my partner, Michael Lebowitz, dug into the December statistics to validate the “Santa Claus” rally. For this analysis, we studied data from 1990 to current to see if December is a better period to hold stocks than other months. The answer was a resounding, “YES.” The 30 Decembers from 1990 to 2020 had an average monthly return of +1.70%. The other 11 months posted an average return of just +0.62%.
The following graph shows the monthly returns and the maximum and minimum intra-month returns for each December since 1990. It is worth noting that more than a third of the data points have returns that are below the average for the non-December months (+0.62%). Further, it is worth noting that 2018 certainly saw a “lump of coal” in investors’ stockings.
Next, we analyzed the data to explore if there are periods within December with price gain clusters. The following two graphs show, in orange, aggregate cumulative returns by day count for the 30 Decembers we analyzed. In the first graph, we plotted returns alongside daily aggregated average returns by day. Illustrated in the second graph is the percentage of positive days versus negative days by day count and returns.
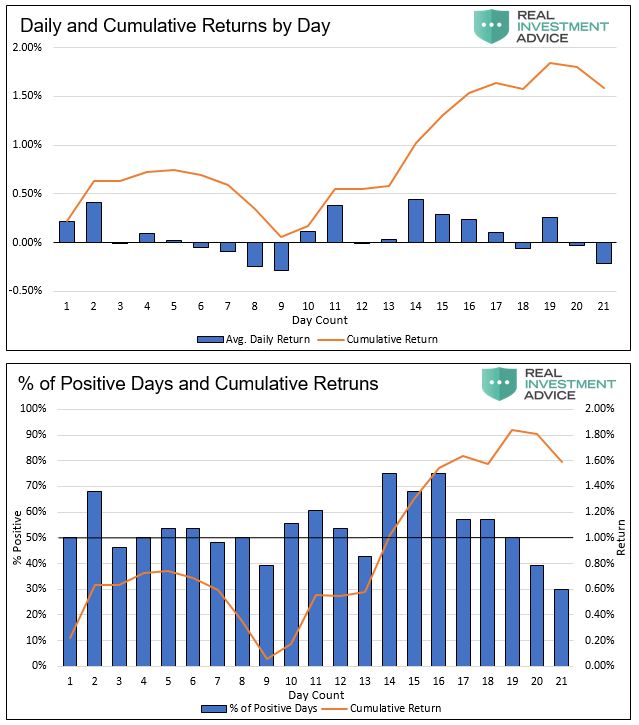
Visually one notices the “sweet spot” in the two graphs occurs between the 10th and 17th trading days. The 17th trading day, in most cases, falls within a day or two of Christmas.
However, with the substantial November advance, the question is whether there is anyone “left to buy?”
Did Everyone Already Buy?
From a technical perspective, the biggest concern is the more extreme levels of exuberance the markets have seen as of late. As noted in “Irrational Exuberance:”
“You have to wonder precisely how much ‘gas is left in the tank’ when even ‘perma-bears’ are now bullish. Therefore, the question we should ask is ‘if everyone is in, who is left to buy?’”
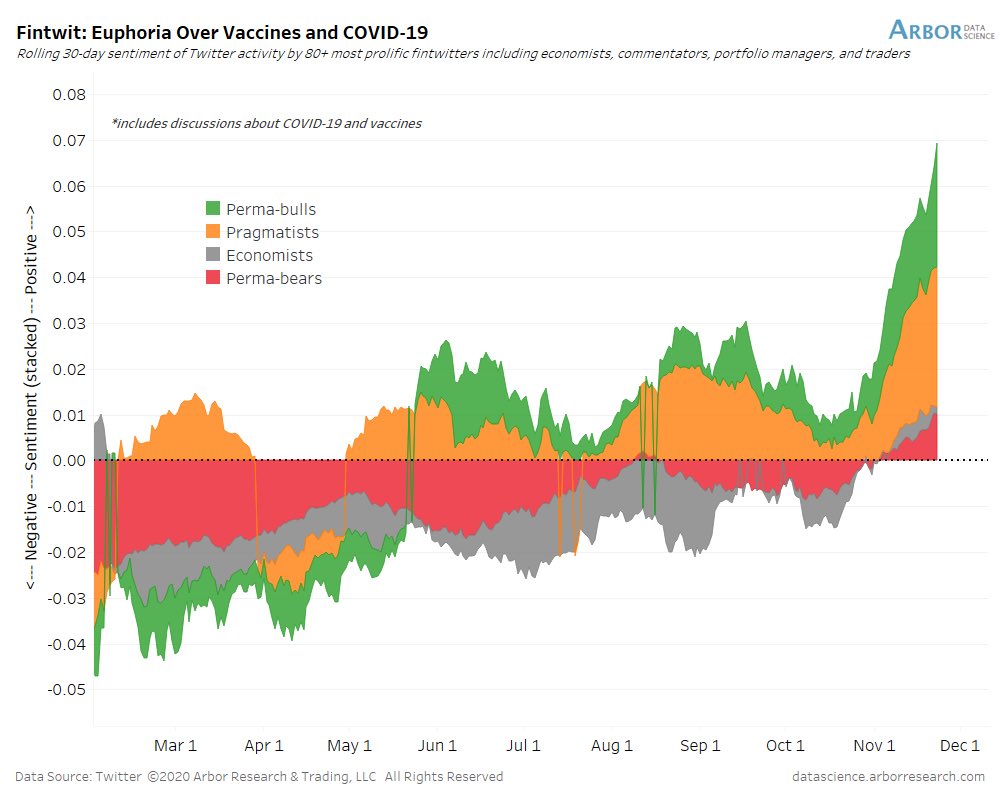
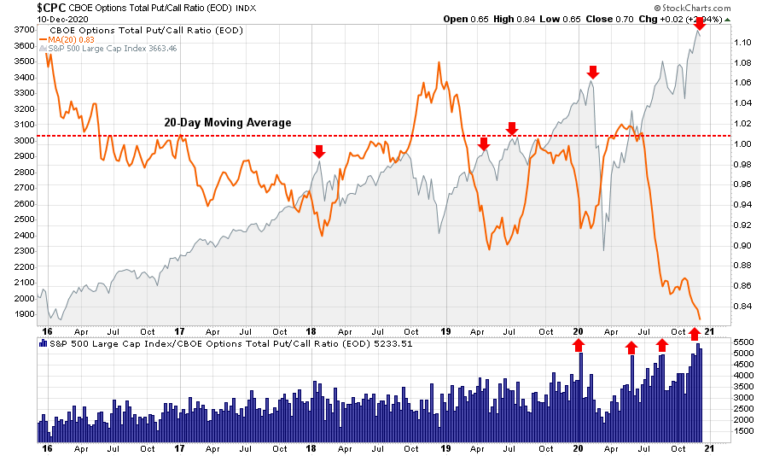
It is not just sentiment, but also the speculative positioning of investors. Currently, options traders are too lop-sided with “put/call” ratios very depressed.
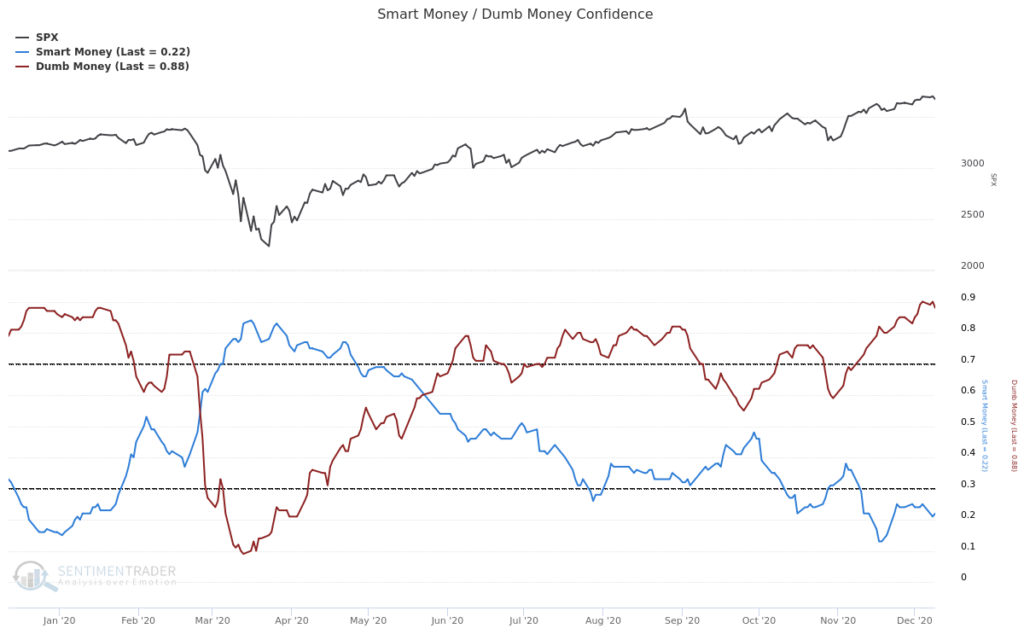
Retail investors are fully-allocated to the equities markets as represented by “dumb-money” positioning.
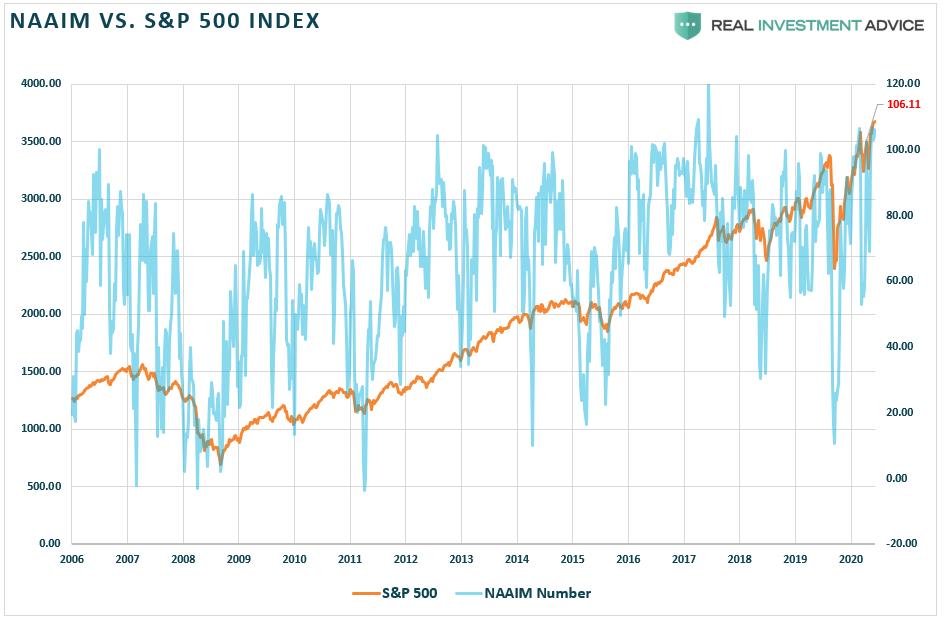
Notably, institutional investors are currently not only “all-in” but “leveraged,” with equity allocations hitting 106% last week.
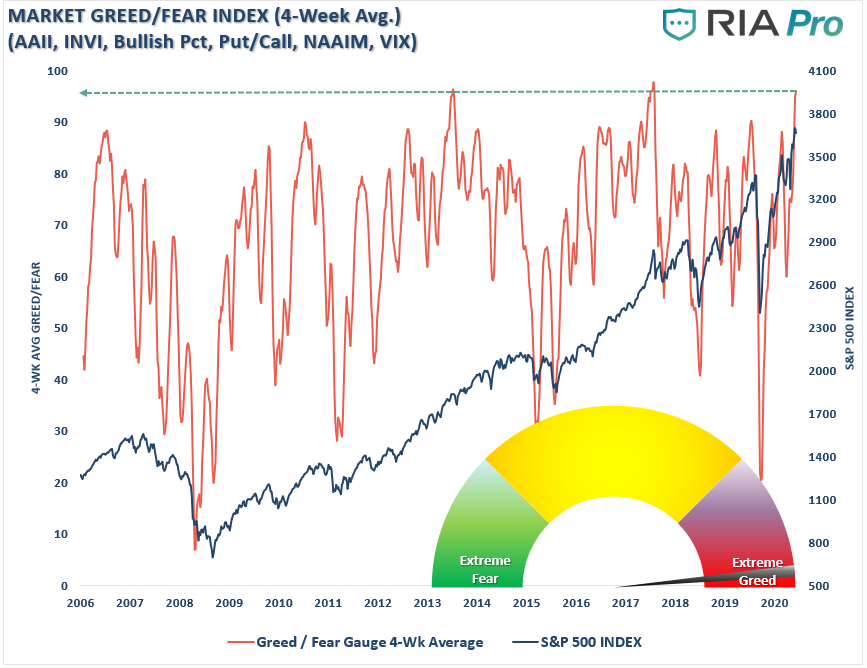
Even our composite “Fear/Greed Gauge,” which represents investor positioning, is also pushing extreme levels.
The bullish shift in positioning has also “stretched” markets to more extreme levels as well.
Technically Stretched
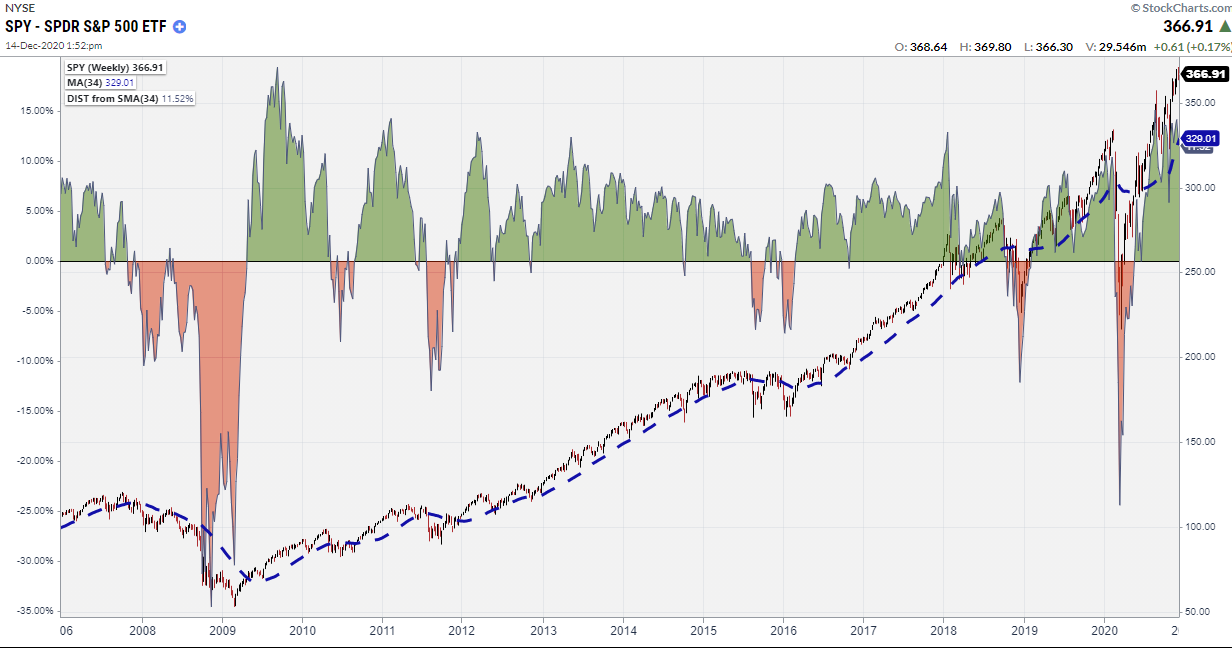
On a technical basis, the market is extremely stretched above longer-term moving averages. As shown below, the S&P 500 index is currently 11.52% above its 34-week moving average. Such levels have often corresponded to short-term corrections in the markets.
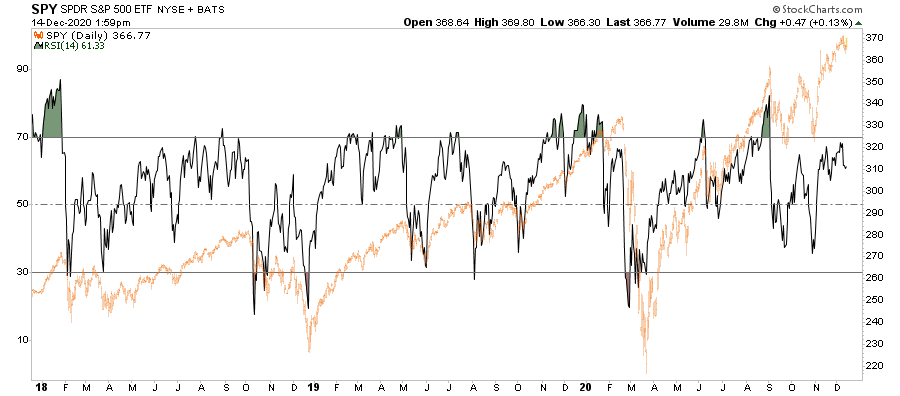
The daily Relative Strength Index (RSI) has also been weak relative to the rally’s magnitude from the March lows. The negative divergence in the relative strength index (declining while the market advances) has historically been a warning sign for investors.
Importantly, none of this means the market is going to start a more significant correction tomorrow. However, multiple signals suggest that short-term selling pressure has picked up, and there is downward pressure on stock prices currently.
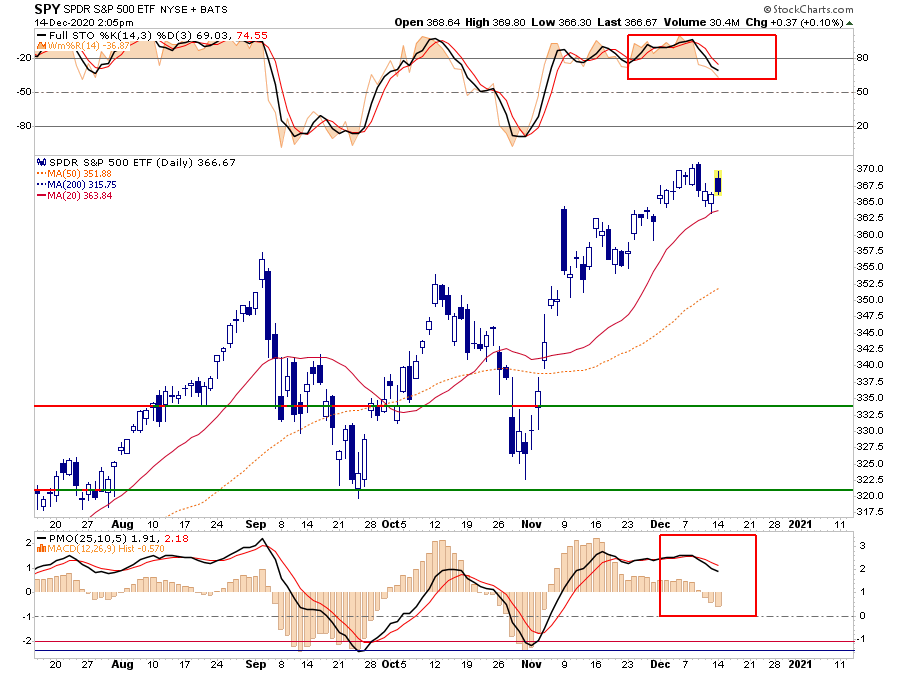
Given that no one can accurately predict the future, all we can do is pay attention to the technical signals and weigh them against the statistical probabilities. With a long history of the “Santa Claus” trade working out favorably for investors, it will likely pay to remain long equities until the end of the year.
However, such does not mean that you have to do it without some risk controls in place. The technical signals suggest there may be some downside risk before “Santa Claus” visits “Broad & Wall.”
Buying Climaxes
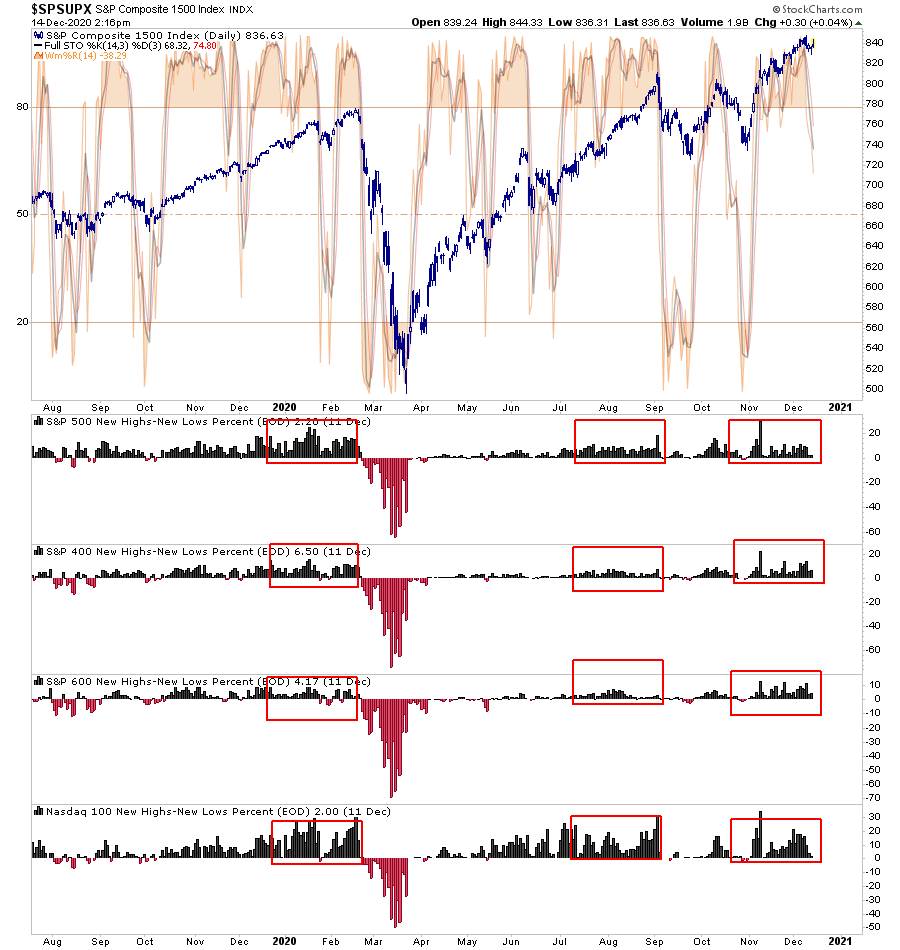
The broad market. As measured by the S&P Composite 1500 (comprised of large-cap S&P 500, mid-cap S&P 400, and small-cap S&P 600) has currently also registered short-term sell signals suggesting further downward pressure on prices. Furthermore, as noted in red boxes, the high-low percentages are pushing levels of “buying,” which have typically corresponded with short-term peaks.
As I have discussed previously, with mutual funds finishing up their annual distributions, portfolio managers and hedge funds will likely look to “Stuff Their Stockings” of highly visible positions to have them reflected in year-end statements.
The problem is the current overbought condition isn’t supportive of an outsized rally over the next couple of weeks. There are also plenty of risks that could pressure stocks further from a government shutdown, no “stimulus bill,” and options expiration all coming due on Friday.
Therefore, here are the rules for the “Santa Rally.”
Rules For “Santa Rally”
If you are long equities in the current market, we recommend following some basic portfolio management rules.
- Tighten up stop-loss levels to current support levels for each position.
- Hedge portfolios against major market declines.
- Take profits in positions that have been big winners
- Sell laggards and losers
- Raise cash and rebalance portfolios to target weightings.
Notice, nothing in there says “sell everything and go to cash.”
Remember, our job as investors is pretty simple – protect our investment capital from short-term destruction so we can play the long-term investment game. Here are our thoughts on this.
Capital preservation
- A rate of return sufficient to keep pace with the rate of inflation.
- Expectations based on realistic objectives. (The market does not compound at 8%, 6% or 4%)
- Higher rates of return require an exponential increase in the underlying risk profile. This tends to not work out well.
- You can replace lost capital – but you can’t replace lost time. Time is a precious commodity that you cannot afford to waste.
Portfolios are time-frame specific. If you have a 5-years to retirement but build a portfolio with a 20-year time horizon (taking on more risk) the results will likely be disastrous.
With forward returns likely to be lower and more volatile than witnessed over the last decade, the need for a more conservative approach is rising. Controlling risk, reducing emotional investment mistakes, and limiting investment capital’s destruction will likely be the real formula for investment success in the decade ahead.
A Final Reminder
Such brings up some essential investment guidelines as we head into year-end.
- Investing is not a competition. There are no prizes for winning but there are severe penalties for losing.
- Emotions have no place in investing.You are generally better off doing the opposite of what you “feel” you should be doing.
- The ONLY investments that you can “buy and hold” are those that provide an income stream with a return of principal function.
- Market valuations (except at extremes) are very poor market timing devices.
- Fundamentals and Economics drive long-term investment decisions – “Greed and Fear” drive short-term trading. Knowing what type of investor you are determines the basis of your strategy.
- “Market timing” is impossible– managing exposure to risk is both logical and possible.
- Investment is about discipline and patience. Lacking either one can be destructive to your investment goals.
- There is no value in daily media commentary– turn off the television and save yourself the mental capital.
- Investing is no different than gambling– both are “guesses” about future outcomes based on probabilities. The winner is the one who knows when to “fold” and when to go “all in”.
- No investment strategy works all the time. The trick is knowing the difference between a bad investment strategy and one that is temporarily out of favor.
While we are certainly anxiously anticipating an arrival from “Santa Claus,” we are also keenly aware of the lesson taught to us in 2020.
Nothing is guaranteed.
