In last week’s Technical Update, I discussed the risks to our short-term bullish view. To wit:
“Next week, the Trump Administration will announce $50 billion in “tariffs” on Chinese products. The ongoing trade war remains a risk to the markets in the short-term.
With global economic growth slowing, trade war risks rising, and liquidity being extracted, there is a rising possibility that tighter global monetary policy will lead to a credit-driven event. This is particularly the case given the rate at which corporations have been gorging themselves on cheap debt to take cash out of their balance sheets for the benefit of their executives and shareholders.”
On Monday, we woke to the “sound of distant drums” beating out the warning of a pending trade war as China vowed to retaliate to the $50 billion in tariffs imposed by the Administration on Friday. To wit:
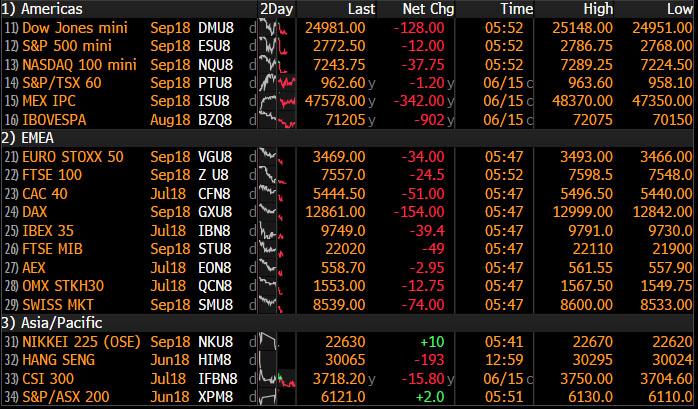
“Global stocks and US index futures are a sea of red this morning amid growing concerns over the escalating trade war between China and the U.S., which on Friday launched tit-for-tat $50BN in tariffs, coupled with the growing risk that Merkel’s government is on the edge of collapse.
Global trade is (once again) back at the top of the wall of worry, with investors afraid that the confrontation between the U.S. and China can escalate out of control, hitting both the global economy and corporate earnings. On Friday, China immediately responded after President Donald Trump slapped tariffs on $50 billion of imports, putting an additional 25 percent levy on $34 billion of U.S. agricultural and auto exports starting July 6.
Analysts expect the U.S.- China confrontation to be a war of attrition: while China has shown a willingness to make a deal on shrinking its trade surplus with the U.S., it has made clear it won’t bow to demands to abandon its industrial policy aimed at dominating the technology of the future.
Looking ahead, Reuters reported the US may impose higher tariffs on an additional $100bn of Chinese imports. If this triggers another round of actions from China, then this second round of trade war will likely be much more damaging for both sides. According to DB, this could reduce China’s GDP growth by 0.3% of GDP, but importantly, the US tariff list will likely include big item consumer goods such as phones, computers, TVs etc, which could mean a lot more workers in China and US consumers would be negatively affected.”
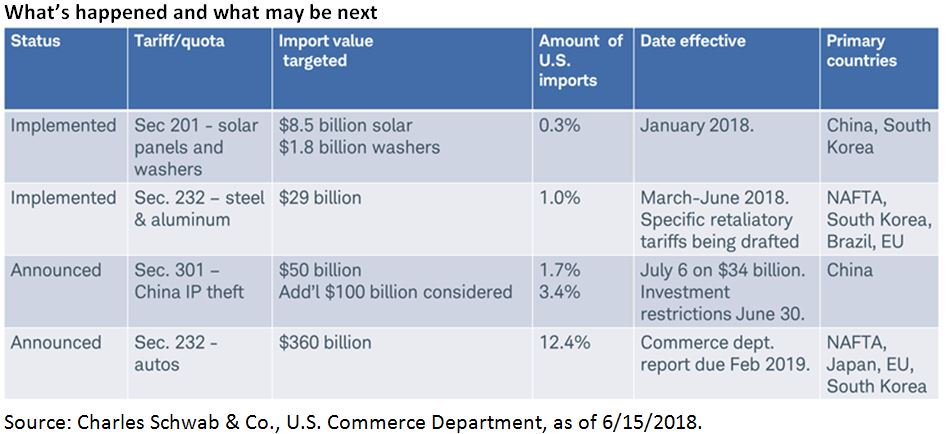
There are many important points in that statement, which we have discussed previously as well. However, for investors, a trade war would likely negatively impact earnings and profitability while slowing economic growth through higher costs. The follow table shows the current and proposed tariffs in play.
Playing The Trade
While the markets have indeed been more bullishly biased in recent weeks, we have couched our short-term optimism with an ongoing view of the “risks” which remain. An escalation of a “trade war” is one of those risks, the other is a policy error by the Federal Reserve which could be caused by the onset of a “trade war.”
Wall Street is ignoring the impact of tariffs on the companies which comprise the stock market. Between May 1st and June 1st of this year, the estimated reported earnings for the S&P 500 have already started to be revised lower (so we can play the “beat the estimate game”). For the end of 2019, forward reported estimates have declined by roughly $6.00 per share.
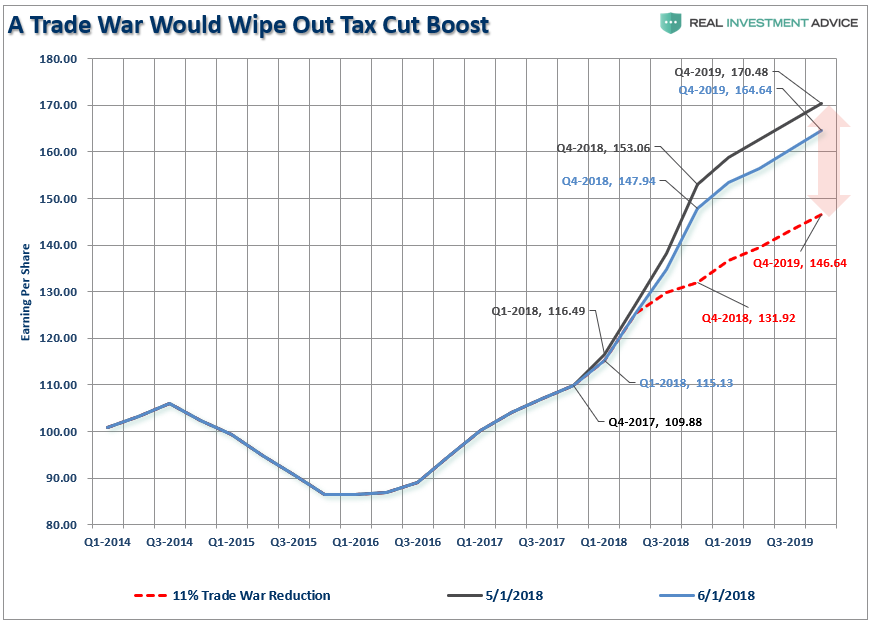
However, the red dashed line denotes an 11% reduction to those estimates due to a “trade war” as noted by Barclays (LON:BARC) Bank yesterday:
“As a result of escalating trade war concerns, Barclays recently estimated the impact in the worst-case scenario of an all-out trade war for US companies across sectors and US trading partners.
In a nutshell, the bank calculated that an across-the-board tariff of 10% on all US imports and exports would lower 2018 EPS for S&P 500 companies by ~11% and, thus, completely offset the positive fiscal stimulus from tax reform.”
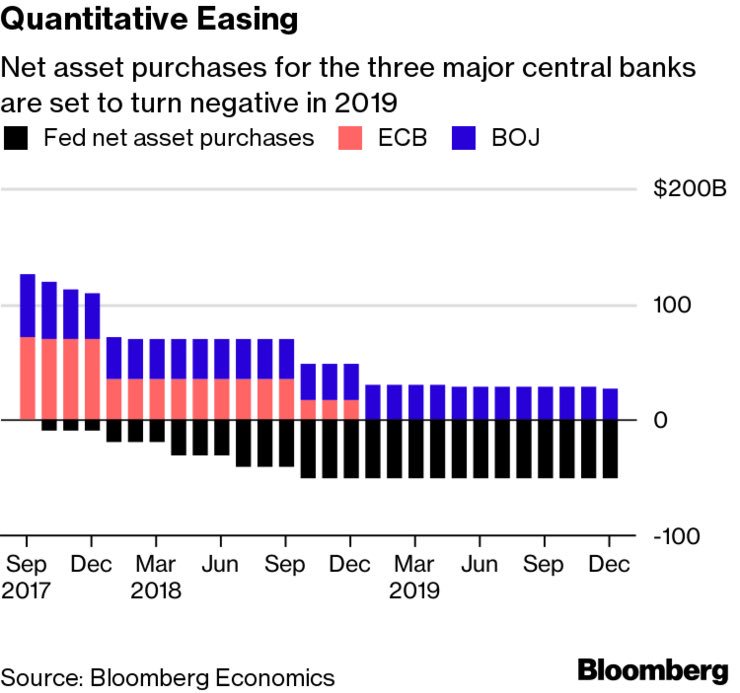
Combine a “trade war” with a Federal Reserve intent on removing monetary accommodation, both through higher rates and reduction in liquidity, and the market becomes much more exposed to an unexpected exogenous event which sparks a credit-related event. (Of course, it isn’t just the Fed, but also the BOJ and ECB.)
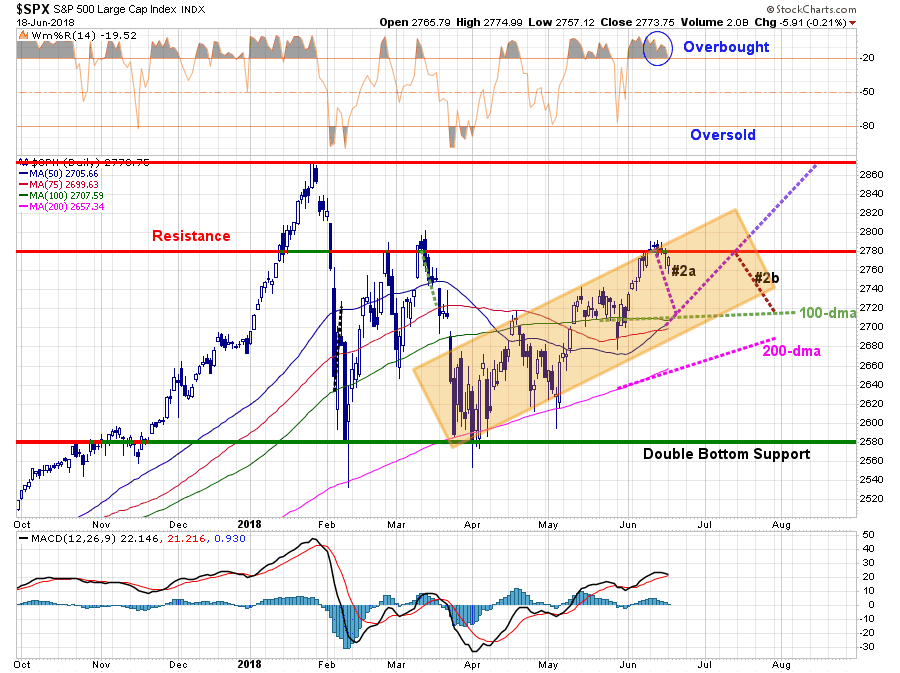
While our longer-term analysis remains more negative, due to both price extension and valuation issues, on a short-term basis, the markets remain confined to the uptrend that began back in April. Our “pathways” currently remain intact as #2a now seems to be the probable outcome currently. (I have cleaned up the chart to only show the two most probable paths currently.)
With the market weakness yesterday, we are holding off adding to our equity “long positions” until we see where the market finds support. Currently, there is a cluster of support coalescing at the 100-dma. The 50-dma is set to cross back above the 100-dma this week, and the downtrend line from the March highs also resides at that juncture.
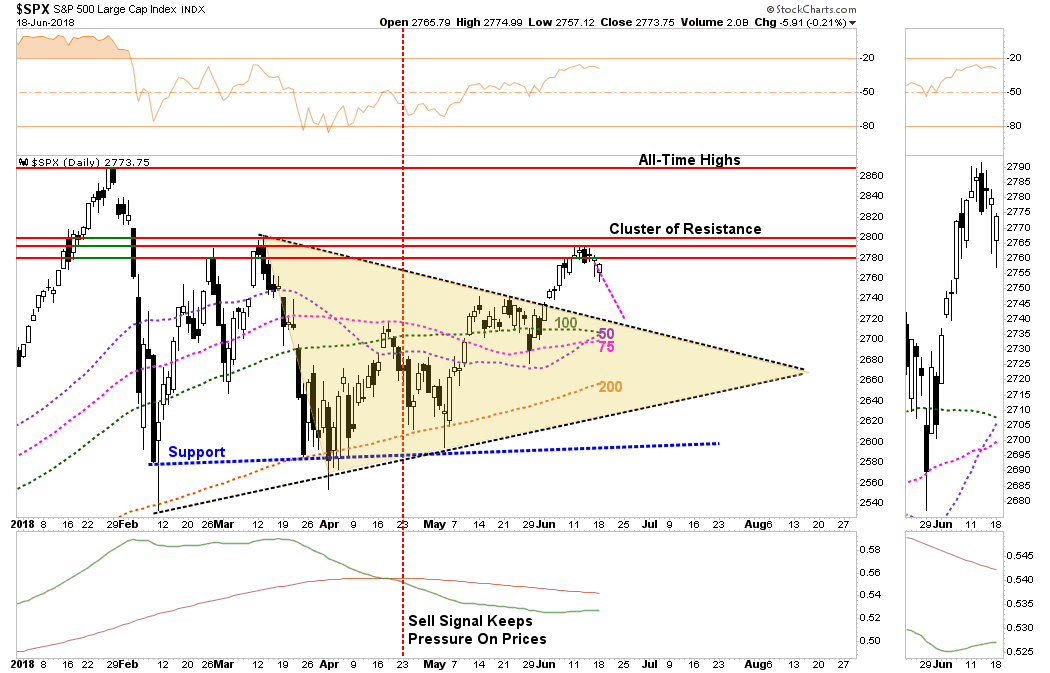
If the markets retrace to that cluster of support, we suspect the market will be sufficiently oversold enough for a reflexive bounce by the end of the month. Again, going back to the pathway chart above, the most probable outcome currently remains a continued sideways and choppy market.
For now.
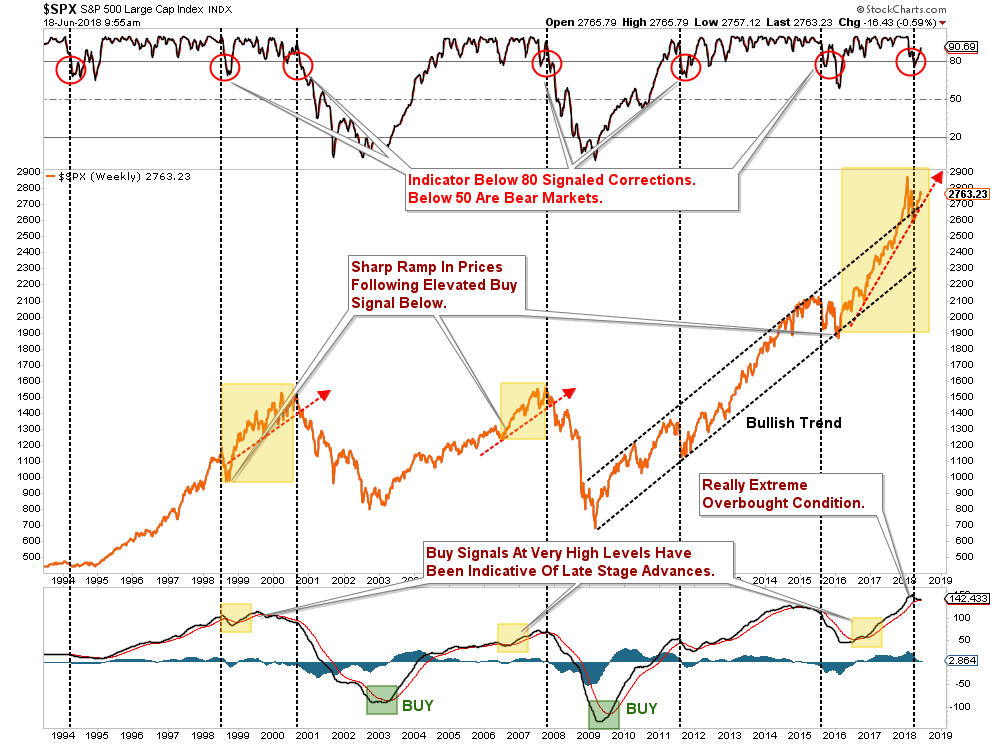
However, longer-term there is little indication the markets have a substantial amount of upside from current levels. As shown in the chart below, the parabolic advance from the 2015-2016 lows have pushed indicators to extremes on many levels. More importantly, we are very close to registering a “sell signal” (bottom panel) at a level higher than previously witnessed at the “dot.com” peak.
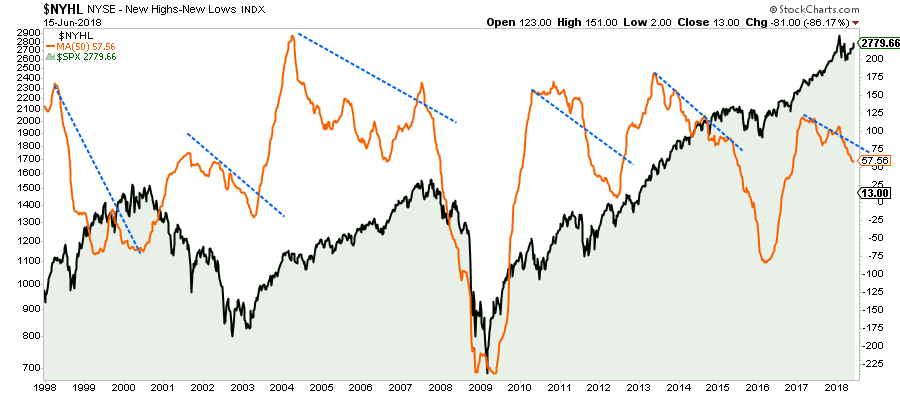
The warning from the chart above also coincides with the deterioration in the breadth of participation of stocks as well.
I want to be exceedingly clear that while our outlook on a short-term basis is more optimistic due to recent market action, the longer-term setup remains very bearish for long-term investors.
Simply, this is no longer a “buy and hold” market environment.
The focus now must shift from “risk taking” to “risk control.” “Capital preservation strategies” now replace “capital growth strategies,” and “cash” now becomes a favored asset class for managing uncertainty.
As a portfolio manager, I must manage short-term opportunities as well as long-term outcomes. If I don’t, I suffer career risk, plain and simple.
However, you don’t have to. If you are truly a long-term investor, you have to question the risk being undertaken to achieve further returns from the second longest bull-market in history.
Assuming that you were astute enough to buy the 2009 low, and didn’t spend the bulk of the bull market rally simply getting back to even, you would have accumulated years of excess returns towards meeting your retirement goals.
If you went to cash now, the odds are EXTREMELY high that you will far outpace investors who remain invested in the years ahead. Sure, they may get an edge on you in the short-term, and chastise you for “missing out,” but when the next “mean reverting event” occurs the decline will destroy most, if not all, of the returns accumulated over the last 9-years.
All I am suggesting, is that if you continue to ride this particular “bull,” do so carefully. Keep stop losses in place, and be prepared to sell when things go wrong.
For now, things do indeed remain weighted towards the bullish camp, however, such will not always be the case, and that could be sooner than most expect.

