In this past weekend’s missive, we discussed the market stalling at the 200-dma. To wit:
We said then the most likely target for the rally was the 200-dma. It was essentially the level at which the ‘irresistible force would meet the immovable object.
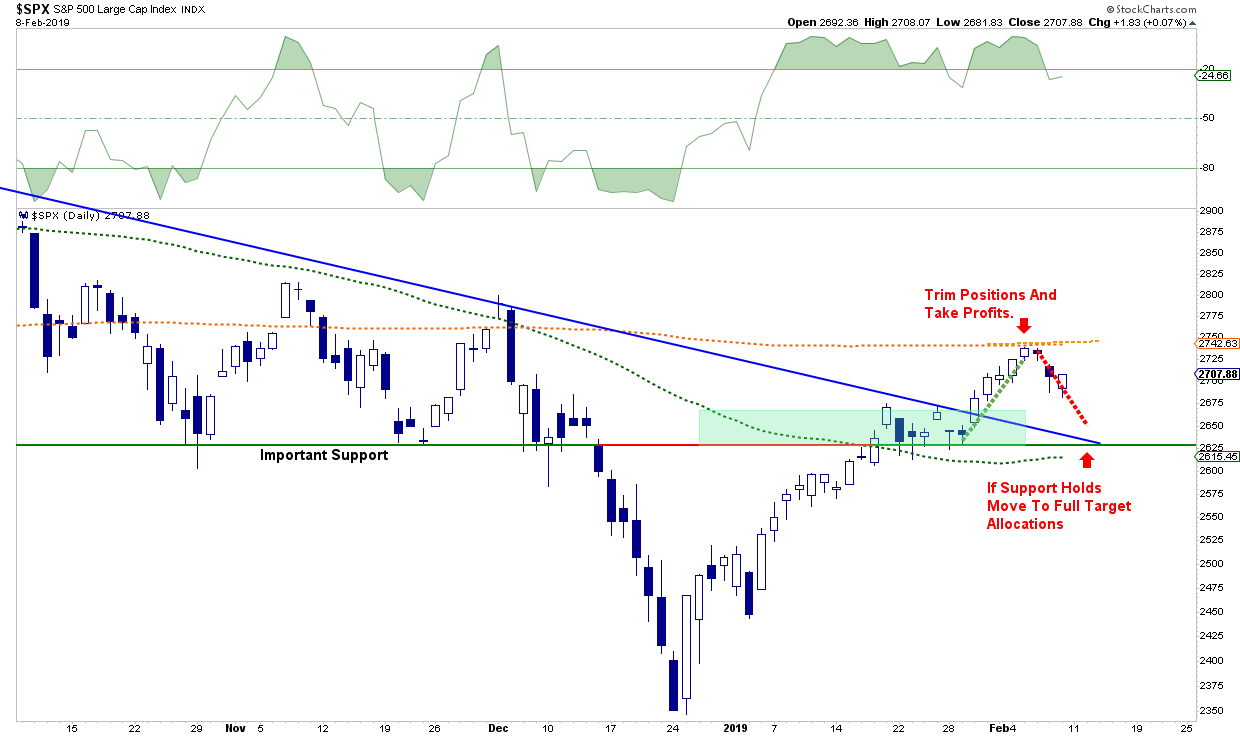
What will be critically important now is for the markets to retest and hold support at the Oct-Nov lows which will coincide with the 50-dma. A failure of that level will likely see a retest of the 2018 lows.
A retest of those lows, by the way, is not an “outside chance.” It is actually a fairly high possibility. A look back at the 2015-2016 correction makes the case for that fairly clearly.
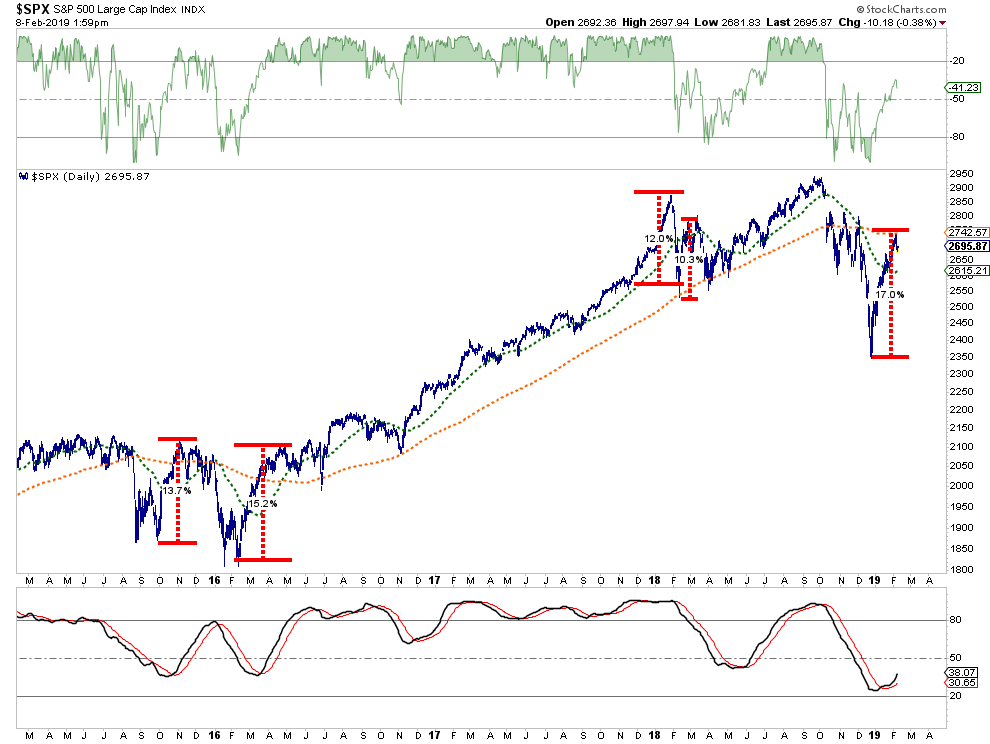
But even if a retest of lows doesn’t happen, you should be aware that sharp market rallies are not uncommon, but almost always have a subsequent retracement.
Importantly, as I expanded to our RIA PRO subscribers:
We are likely going to have another couple of attempts next week as the bulls aren’t ready to give up the chase just yet. We are continuing to watch the risk carefully and have been working on repositioning portfolios over the last couple of weeks.
As noted, we lifted profits at the 200-dma and added hedges to the Equity and Equity Long/Short portfolios.
On Monday, the markets rallied a bit out of the gate over continuing hopes of a “trade deal” between the U.S. and China but fell back to even by the end of the day. With earnings season now largely behind us, the “bulls” are going to need improving economic data and relief from Washington to provide continued support for the rally.
This morning, futures are once again pointing higher on news that a proposal is ready to be sent to the president providing just $1.7 billion for border “security,” no wall, to avert another Government shut down. It is highly likely the bill will be rejected by the President and he will start talking about the use of a “national security” issue to fund the building of the wall. This will divide Congress even more than it is already almost ensuring NO legislation passes before the end of the President’s first term.
Also, talks are once again starting with China over trade. This is also buoying markets in the short-term in hopes of a resolution to reduce the impact of tariffs on businesses. Hopes for a noteworthy “deal” remain extremely slim at this point.
But those two issues are actually relatively minor as other issues, as noted on Saturday, will actually bear much more weight on the market going forward.
- Earnings estimates for 2019 have sharply collapsed as I previously stated they would and still have more to go. In fact, as of now, the consensus estimates are suggesting the first year-over-year decline since 2016.
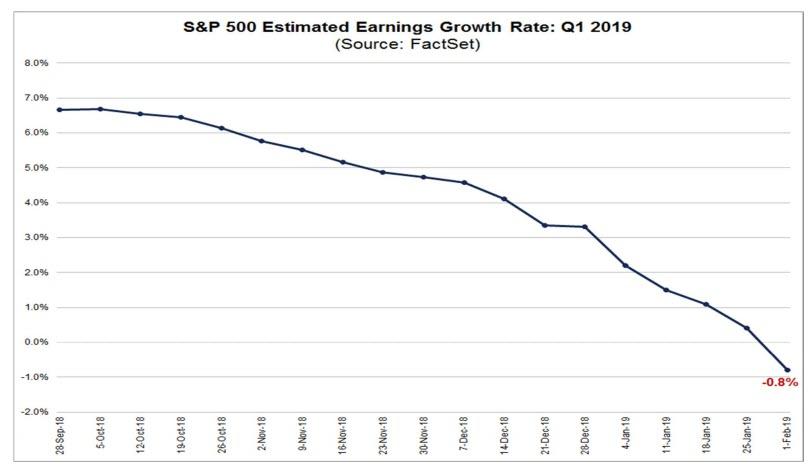
- Stock market targets for 2019 are way too high as well.
- Despite the Federal Reserve turning more dovish verbally, they DID NOT say they actually WOULD pause their rate hikes or stop reducing their balance sheet.
- Larry Kudlow said the U.S. and China are still VERY far apart on trade.
- Trump has postponed his meeting with President Xi which puts the market at risk of higher tariffs.
- There is a decent probability the U.S. Government winds up getting shut down again after next week over “border wall” funding.
- The effect of the tax cut legislation has disappeared as year-over-year comparisons are reverting back to normalized growth rates.
- Economic growth is slowing as previously stated.
- Chinese economic has weakened further since our previous note.
- European growth, already weak, will likely struggle as well.
- Valuations remain expensive
Of course, despite those more macro-concerns, the market has had a phenomenal run from the “Christmas Eve” lows and has moved above both the Oct-Nov lows and the 50-dma. This is clearly bullish in the short-term for investors. With those levels of previous resistance now turned support, there is a little cushion for the bulls to hold on to.
The biggest hurdle for a bullish advance from current levels is the cluster of resistance sitting just overhead. Sven Heinrich noted the market remains stuck below the collision of the 200-day, the 50-week, and the 15-month moving averages.
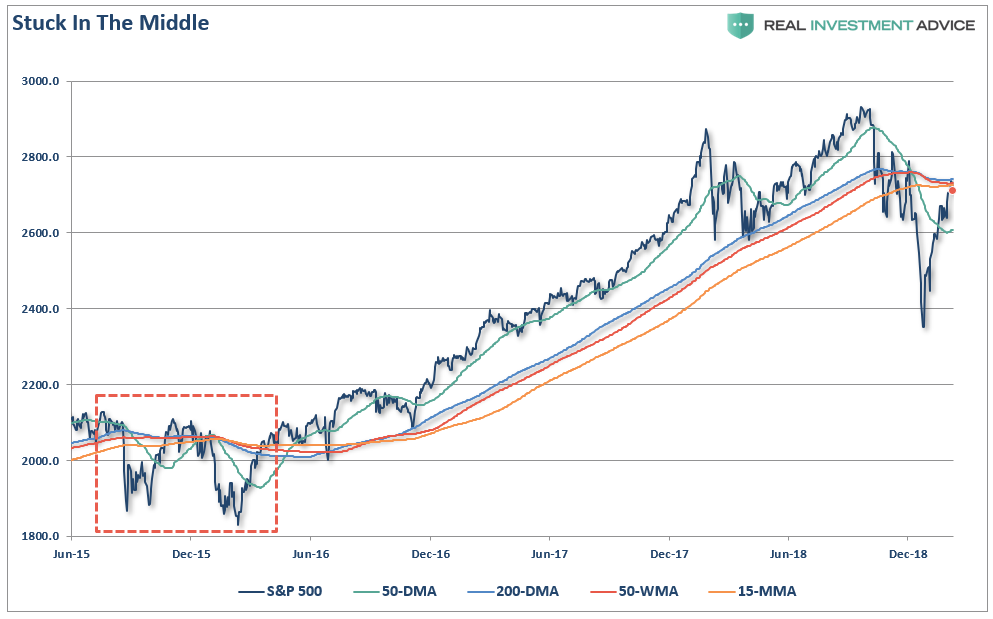
As shown, this set up previously existed back in late 2015 and early 2016. The initial challenge saw the market actually break back above the cluster of resistance, which “sucked the bulls” back into the market before setting new lows.
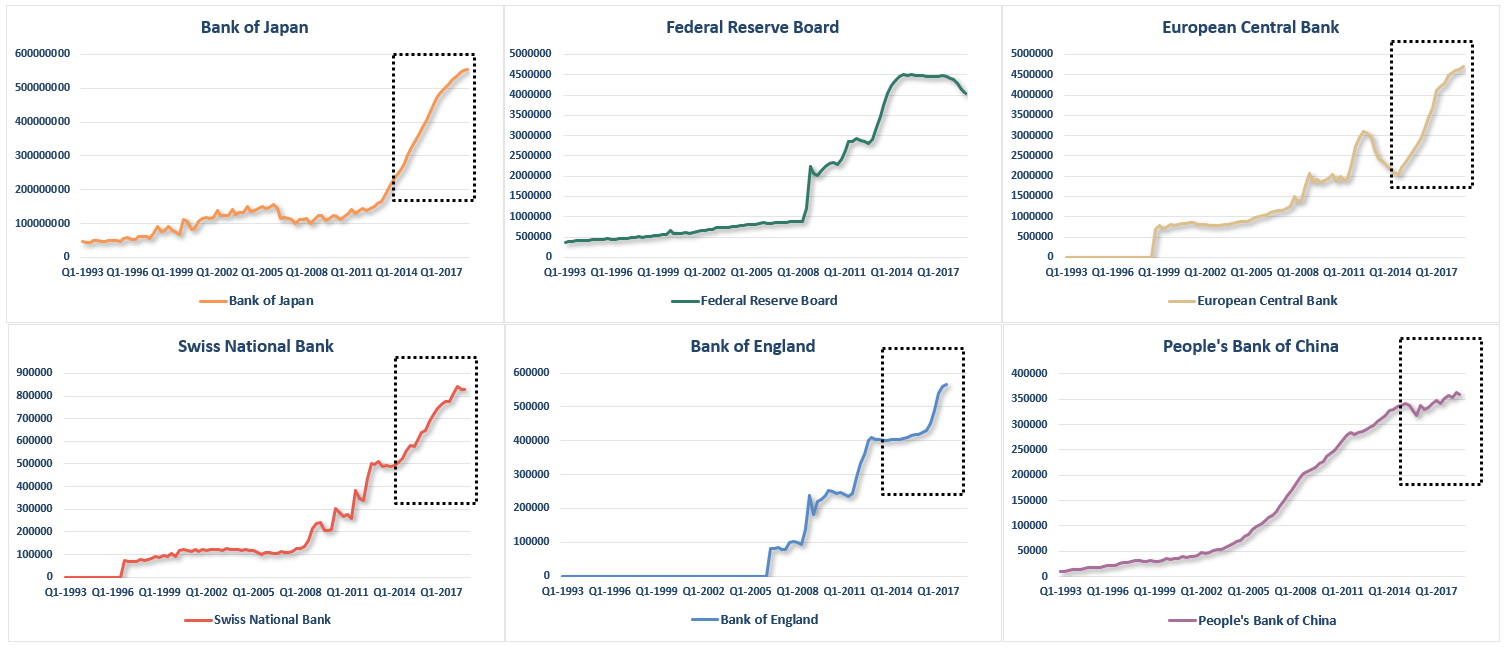
The correction, that was then in process, was cut short by massive infusions of global liquidity.
Global Central banks had stepped in to flood the system with liquidity. As you can see in the chart below, while the Fed had stopped expanding their balance sheet, everyone else went into over-drive.
Another concern for a further rally is that investor allocations never got extremely bearish. The chart below compares the S&P 500 to various measures of Rydex ratios (bear market to bull market funds)
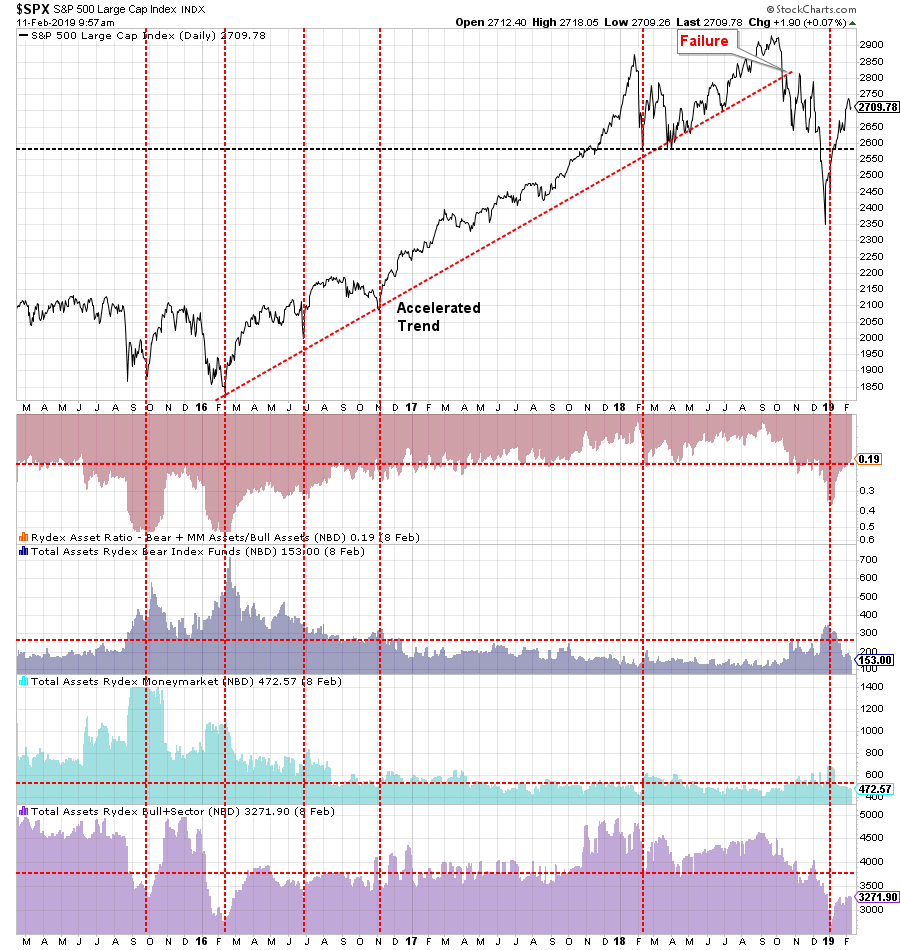
Note that during the recent sell-off, the move to bearish funds never achieved the levels seen during the 2015-2016 correction. More importantly, the snap-back to “complacency” has been quite astonishing. The next chart puts it into a longer-term perspective for comparison.
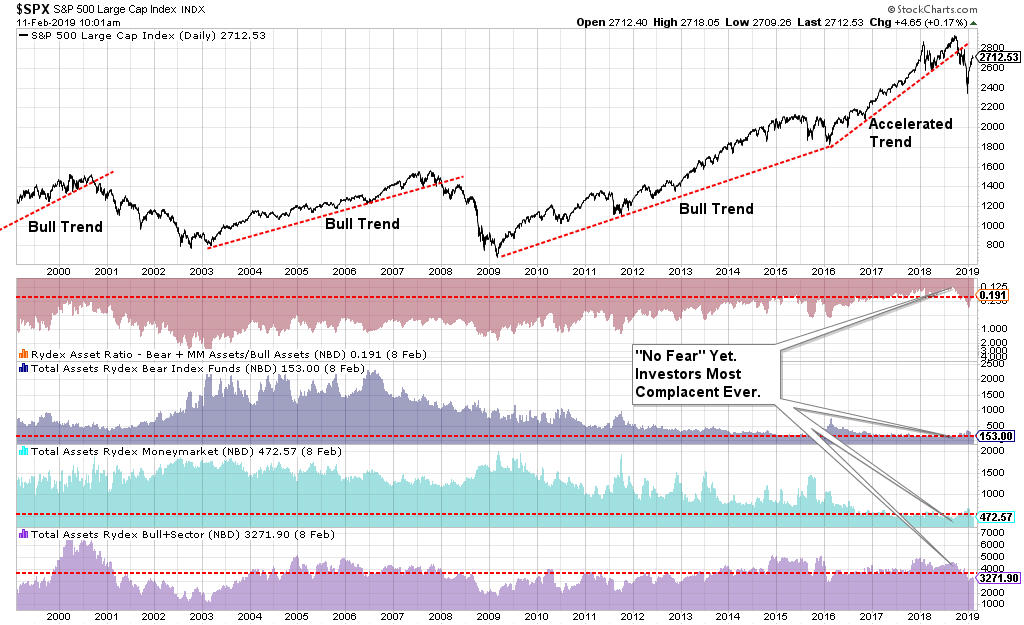
Despite the depth of the decline, and the belief that the “bear market” of 2018 is now complete, it is worth noting the reversion in investor positioning has not even begun to approach levels seen during an actual “bear market.”
But stepping back to the long-term trends, when managing money the most important part of the battle is getting the overall “trend” right. “Buy and hold” strategies work fine in rising price trends, and “not so much” during declines.
The reason why most “buy and hold” supporters suggest there is no alternative is because of two primary problems:
- Trend changes happen slowly and can be deceptive at times, and;
- Bear markets happen fast.
Since the primary messaging from the media is that “you can’t miss out” on a “bull market,” investors tend to dismiss the basic warning signs that markets issue. However, because “bear markets” happen fast, by the time one is realized, it is often too late to do anything about it.
So, you just have to ride it out. You don’t have any other option. Right?
The chart below is one of my favorites. It is a monthly chart of several combined indicators which are excellent at denoting changes to overall market trends. The indicators started ringing alarm bells in early 2018 which is when I begin talking about the end of the “bull market” advance.
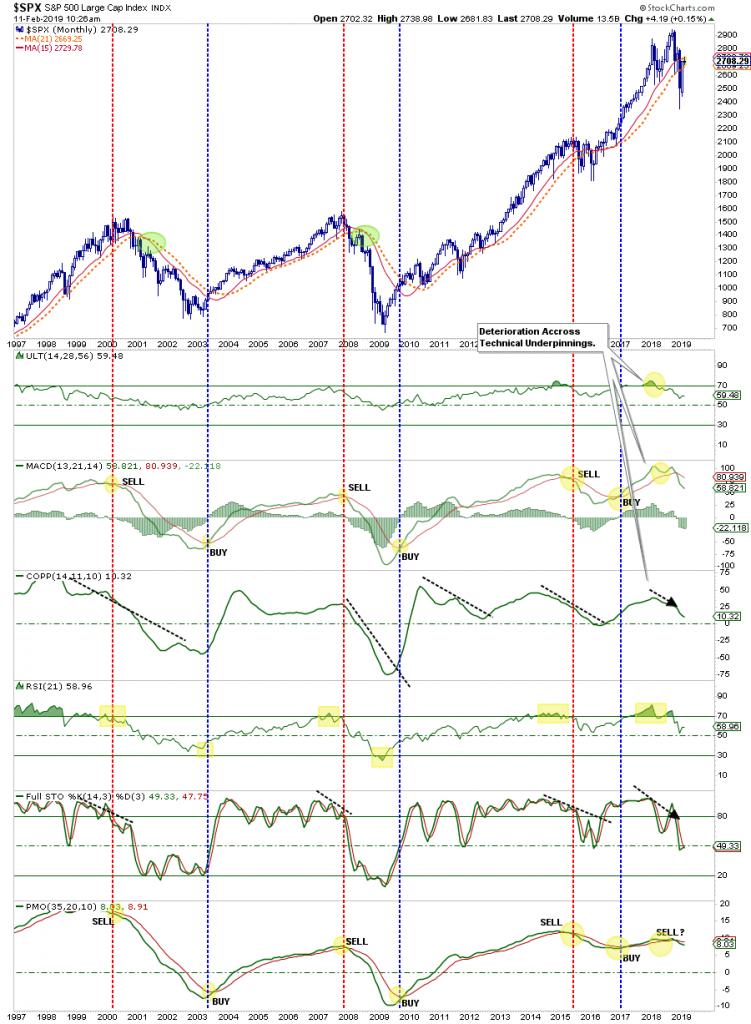
Currently, every single monthly indicator, as of the end of January, is currently suggesting downward pressure on the market. The only signal that has yet to confirm is the cross of the 15-month and 21-month moving averages. The 21-month moving average has pretty much been both support and/or resistance, to the overall trend of the market for the past 25-years. At present, the market is “trapped in the middle” between those two monthly averages.
If the bull market is going to resume, the market needs to break above the 15-month moving average and rally enough to reverse the torrent of sell-signals running across the complex of price indications. With earnings and economic growth weakening, this could be a tough order to fill in the near term.
So, for now, with our portfolios underweight equity, overweight cash and fixed income, we remain “stuck in the middle with you.”
