As July comes to an end, should we be looking for a sellable rally to reduce risk? As addressed in “Fed Stimulus Has Created The Cobra Effect,” the failure of the market to “breakout” of the June highs raises our risk. To wit:
“With the late week sell-off, we have updated our risk/reward ranges below. Unfortunately, the market failed to hold its breakout, which keeps it within the defined trading range. The market did hold its rising bullish uptrend support trend line, which keeps the “bullish bias” to the market intact for now."
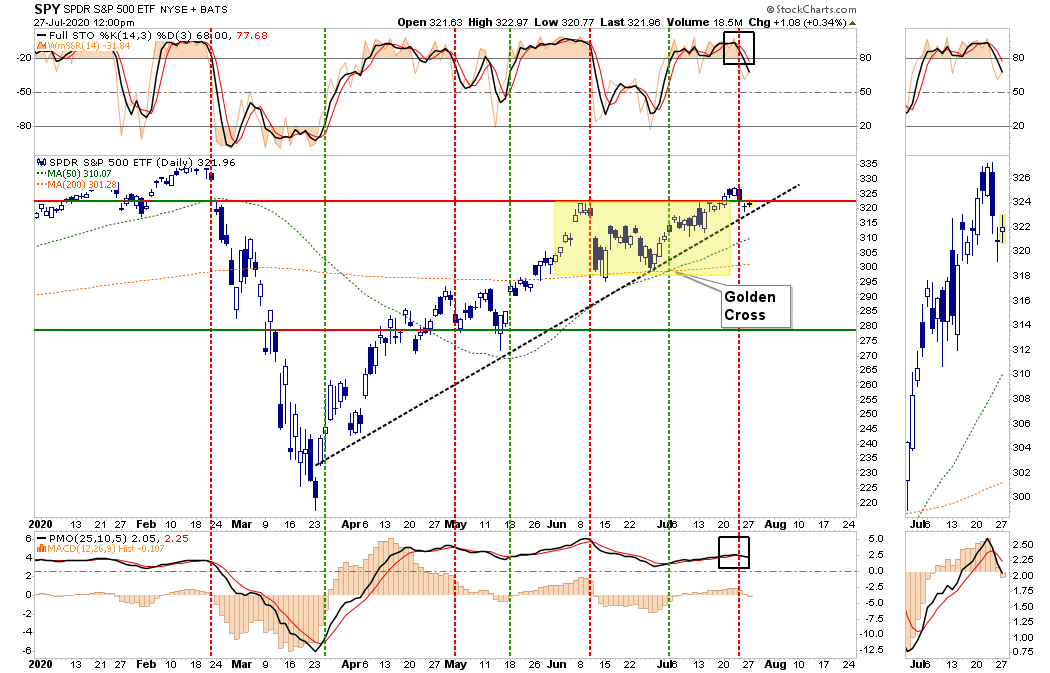
The ‘not-so-bullish’ aspect is that all four (4) of the primary buy/sell indicators have now tripped into “sell” territory. Such does not mean an imminent crash for the market. It does suggest upside is limited in the near term.”
A Rising Deviation
Yesterday, the markets rallied a bit on hopes for additional “stimulus” support from the government, as another $1 trillion package is being bantered about. Given the broad differences between the Senate’s proposal and the House’s $3 trillion packages, there is a substantial risk of failure of quick passage. Such could certainly roil markets near term.
Furthermore, while the rally off the March lows has been substantial, there is still a vast disconnect between the markets and the underlying economic fundamentals. Given the divergence was driven by unprecedented monetary policy, the eventual reversion could be climatic.
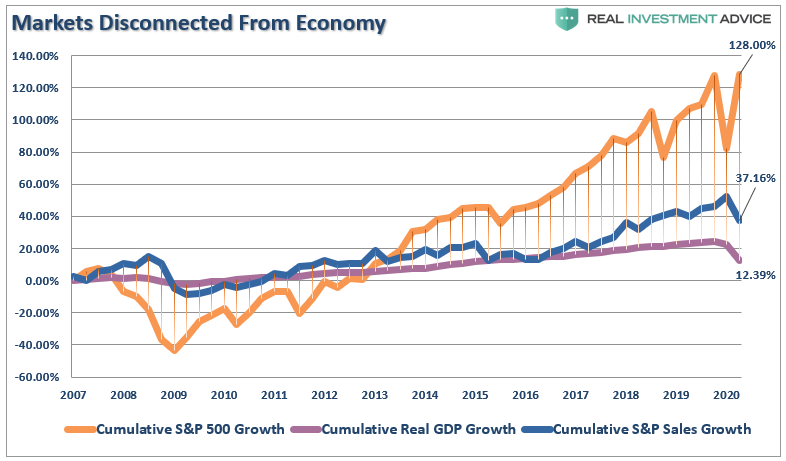
Earlier this month, we discussed taking profits out of our most egregiously overbought technology stocks. As the end of July approaches, there are several reasons why we are looking for a “sellable rally” to reduce risk further.
Psychology:
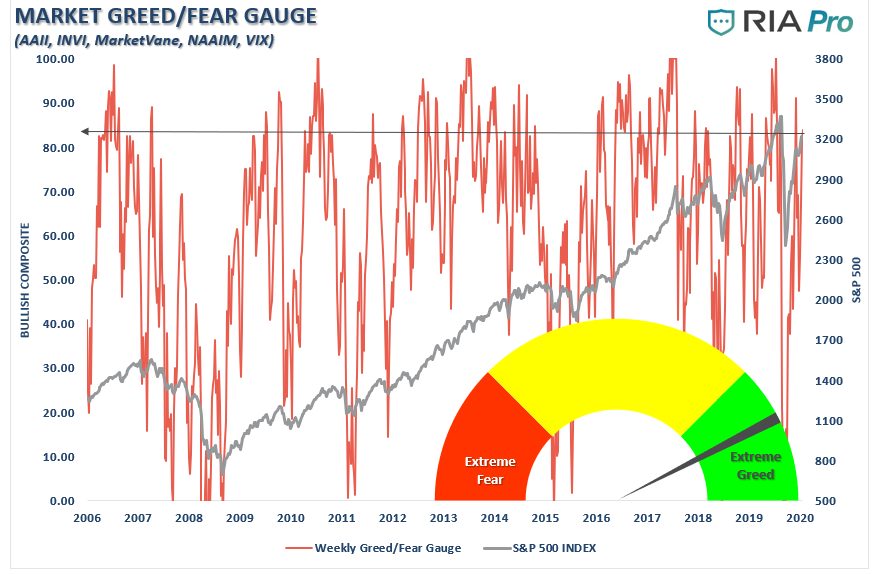
Despite the detachment of the market from the underlying fundamentals, investors have gotten much more “exuberant.” The RIAPro Greed/Fear Gauge is a function of how investors are “positioned” in the market. Currently, at 83.15, investors are very optimistic about future returns. Historically, levels of 80 and above have served as a “contrarian” indicator.
The same goes for positioning by looking at the Rydex bullish-funds-to-bearish-funds ratios. Despite the 35% plunge to March lows, investors remain bullishly biased in their positioning. Such suggests that investors remain aggressively positioned in equities, providing additional fuel for a market correction.
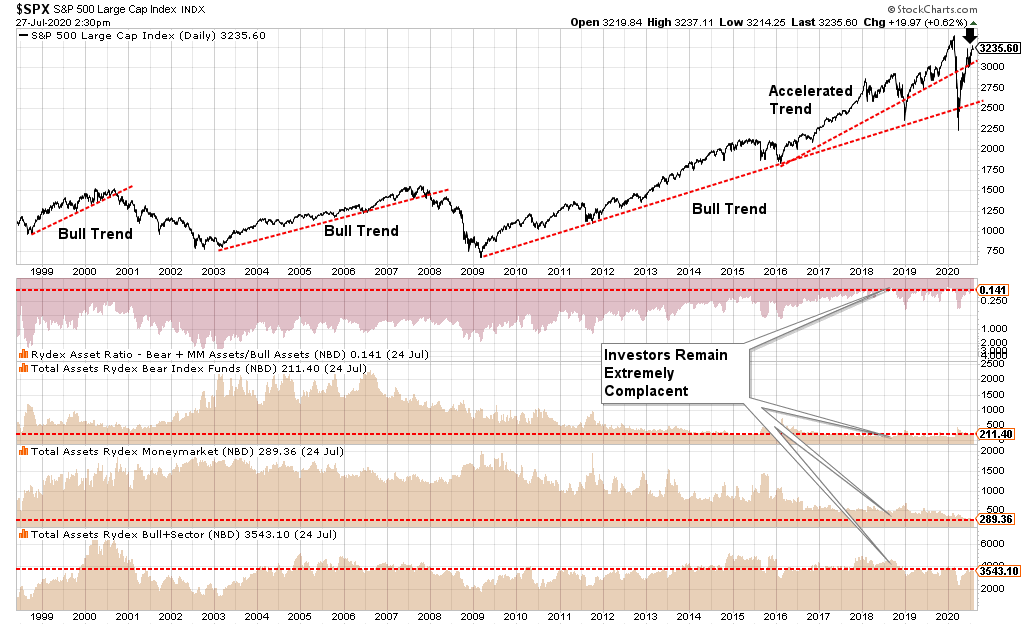
The current psychological conditions suggest a short-term top in the markets is likely. Importantly, none of the data suggests the next great “bear market” is upon us. However, in the short-term, it does suggest that downside risk may outweigh further upside reward currently.
Longer-term risks are more substantial.
Fundamental:
While “valuations” are a terrible market timing indicator and should not be used for such, they tell us just about future returns from investing. However, there are times, like now, where valuations can also tell us about the “rationalization” of investors to support an “overly bullish” bias.
As Jim Bianco recently noted, investors are trying to rationalize paying excessive valuations for stocks today by using forward earnings estimates. The last time forward valuations were this expensive was at the peak of the Dot.com bubble.
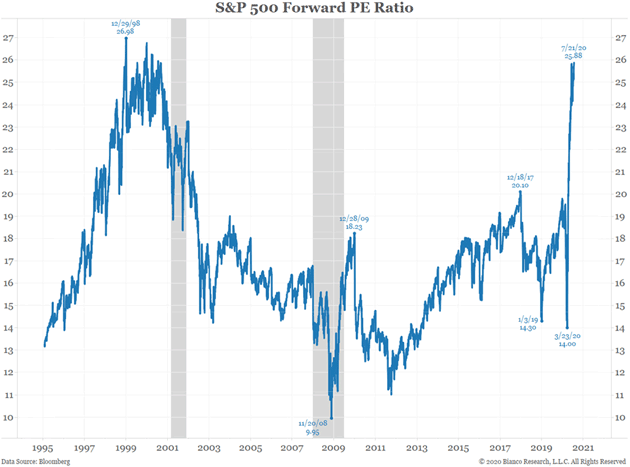
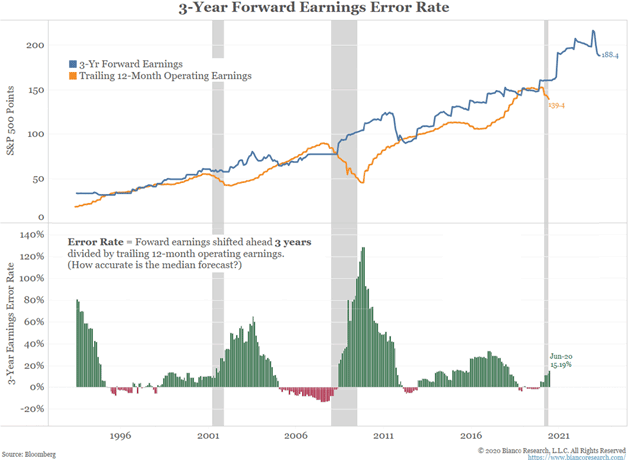
Given that analysts are always overly optimistic about the future, we can assume that earnings will be worse than projected. Such means investors have vastly overpaid for ownership of equities, but to rationalize that ownership, they are now using estimates 3-years into the future.
Jim’s chart uses 3-year forward earnings estimates, which shows that stocks are not cheap, regardless of the metric.
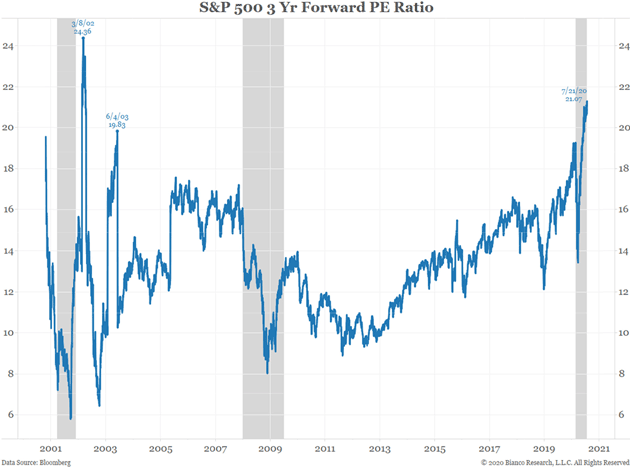
The problem, as I stated above, is that analysts are always overly optimistic. Such means that whatever rationalization you are using to buy stocks today thinking they are “cheap,” will wind up being very wrong tomorrow.
Valuations Matter A Lot
As John Mauldin noted recently:
“This chart overlays stock market performance and valuation. This chart (1) demonstrates the strong effect that valuation has on future returns, and (2) provides a gaze at the future for likely returns over the next 10-years!
The line in the chart is valuation, as measured by P/E. The bars in the chart reflect the 10-year total return for the S&P 500 Index. The line is shifted forward 10-years so the P/E aligns with each bar. That is the value for P/E at the start of the 10-years.
Peaks in the line correspond to troughs in 10-year returns. Similarly, dips in the line correspond with peaks in 10-year returns. Valuation matters!”
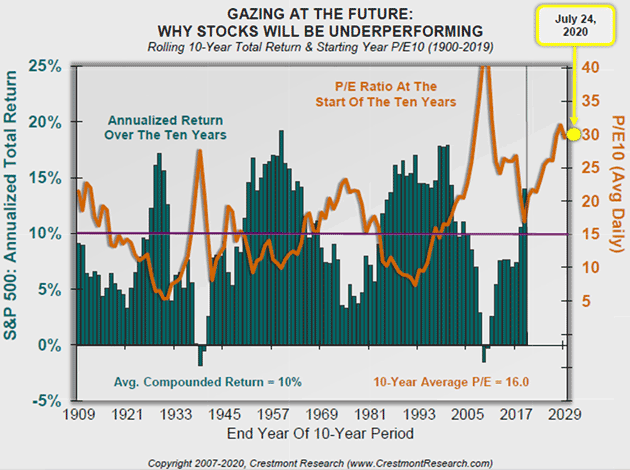
As stated above, while valuations are a terrible market timing indicator in the short-term, it tells you everything you need to know about returns long-term. Such is a lesson that young investors on Robinhood have yet to learn. Unfortunately, that lesson is taught always in the most brutal of fashions.
If history is a guide and always is, the valuation principles will remain true, and low single-digit returns will likely be the future.
Breadth
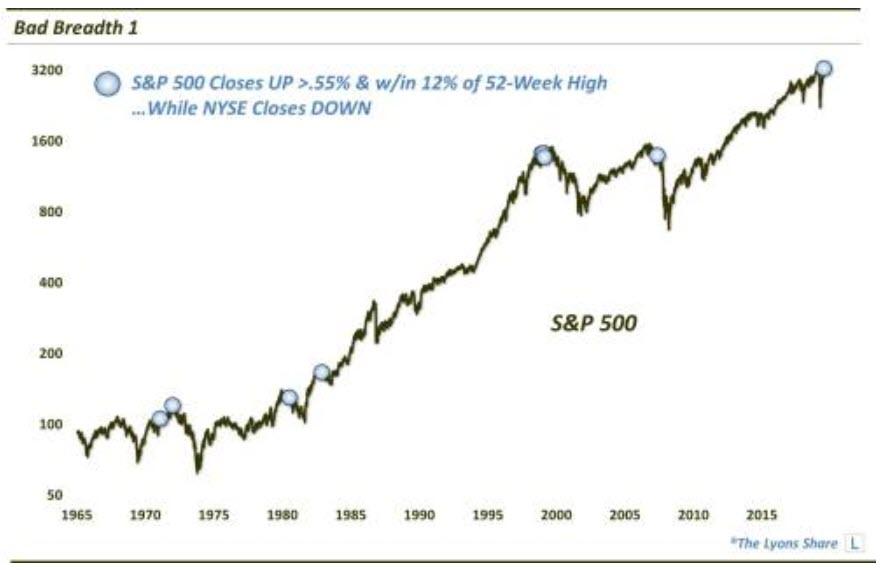
One of the big concerns we have had for some time has been the “lack of breadth” in the rally. As Bob Farrell once stated:
“Bull markets are strongest when broad and weakest when narrow.”
Such was a point noted by my brilliant colleague Dana Lyons last week:
“Relaxing the parameters a bit, we dove a little deeper into the data and identified all days during that period that saw the SPX gain at least 0.55%, while within 12% of a 52-week high, when the NYSE closed down on the day. This chart shows all 9-such days in the past 55 years.”
Our friends at SentimenTrader also confirmed much the same yesterday:
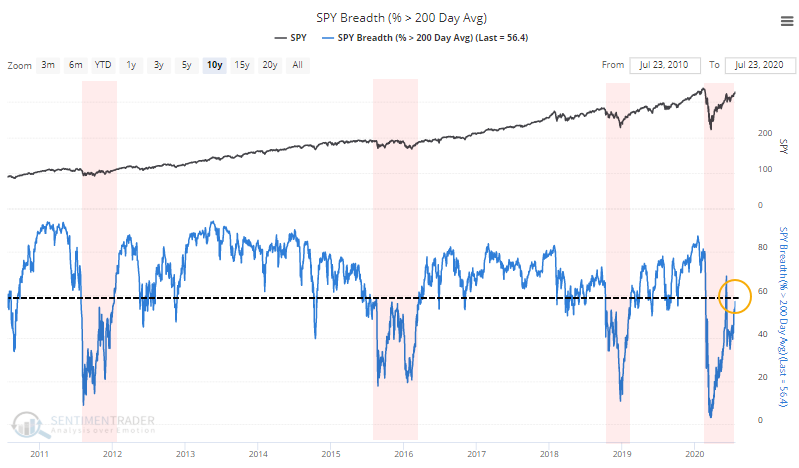
“Simply looking for prices above/below the 200-day moving average works just about as well as complex trend models, and it’s a good, clear-defined alternative. Combine that with a simple view of whether prices are making higher highs and higher lows (bull trend), lower highs and lower lows (bear trend), or both (neutral trend) and you can get an excellent sense for whether bulls or bears are in control. Those are mixed right now, with a slight edge to the bullish camp.
Healthy environments consistently see more than 60% of stocks, industries, sectors, and countries holding above their 200-day averages. Unhealthy environments consistently see fewer than 60% of these above their averages, and spikes above that level tend to get sold quickly.
That’s where we are now. In addition to a large number of stocks trailing the S&P by double-digits, fewer than 60% have held above their 200-day averages. When it spiked above 60% in June, selling pressure picked up immediately.”
Dumb Money Warning
Another clear warning has been that of retail investors. SentimenTrader had this to say:
“We’ve often noted that during times of unhealthy market environments, when fewer than 60% of stocks can hold above their 200-day averages, that periods of high optimism tend to lead to below-average forward returns.
We’re seeing that now, to a historic degree. Since we’ve been tracking this data, just over 20 years, there has never been a day when Dumb Money Confidence was at or above 80% while fewer than 60% of stocks in the S&P 500 were trading above their 200-day averages. Until now.”
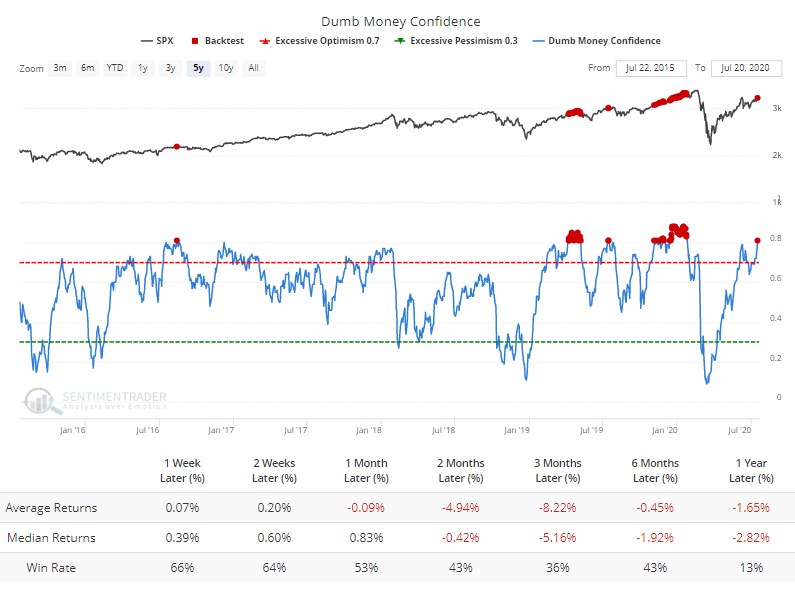
When “bad breadth” collides with excessive “optimism,” you have all the ingredients for a short-term market reversal.
The only question is what will cause it?
Unfortunately, no one knows the answer. This is why we hedge risk to protect capital.
The Rules For A Sellable Rally
As SentimTrader went on to state:
“Helping to push this higher was recent record-setting option speculation. Even though some of the market’s leaders stumbled last week, the Options Speculation Index remains near a 20-year high. Plus, we have the added headwind of being in the most seasonally unfavorable period for stocks.”
I have spoken about the risk to markets over the next couple of months not only from seasonality, but also declining economic data, and a potentially complex Presidential election.
With the market currently overbought, and on a short-term sell signal, it is likely a time to reduce risk somewhat until a better “setup” emerges.
Therefore, use rallies to:
- Re-evaluate overall portfolio exposures. We will look to initially reduce overall equity allocations.
- Use rallies to raise cash as needed. (Cash is a risk-free portfolio hedge)
- Review all positions (Sell losers/trim winners)
- Look for opportunities in other markets (The dollar is extremely oversold.)
- Add hedges to portfolios
- Trade opportunistically (There are always rotations which can be taken advantage of)
- Drastically tighten up stop losses. (We had previously given stop losses a bit of leeway as long as the bull market trend was intact. Such is no longer the case.)
The Risk Of Ignoring Risk
There remains an ongoing bullish bias that continues to support the market near-term. Bull markets built on “momentum” are very hard to kill. Warning signs can last longer than logic would predict. The risk comes when investors begin to “discount” the warnings and assume they are wrong.
It is usually just about then the inevitable correction occurs. Such is the inherent risk of ignoring risk.
In reality, there is little to lose by paying attention to “risk.”
If the warning signs do prove incorrect, it is a simple process to remove hedges, and reallocate back to equity risk accordingly.
However, if these warning signs do come to fruition, then a more conservative stance in portfolios will protect capital in the short-term. A reduction in volatility allows for a logical approach to making further adjustments as the correction becomes more apparent. (The goal is not to be forced into a “panic selling” situation.)
It also allows you the opportunity to follow the “Golden Investment Rule:”
“Buy low and sell high.”
So, now you know why we are looking for a “sellable" rally.
