Is the narrative all “priced in?”
As discussed over the past couple of weeks, investors have gone “all in.” With the markets now extremely extended, what should investors do now?
On Saturday, I discussed the risks as we head into distribution season.
“Given the ongoing extremes of the market, the imbalances suggest a more cautious approach to portfolios currently. As such, we continued reducing our equity exposure, adjusting our bond holdings, and raising our cash levels.
As shown below, with fund managers carrying some of the lowest cash balances on record, we could see selling pressure to make distributions.”
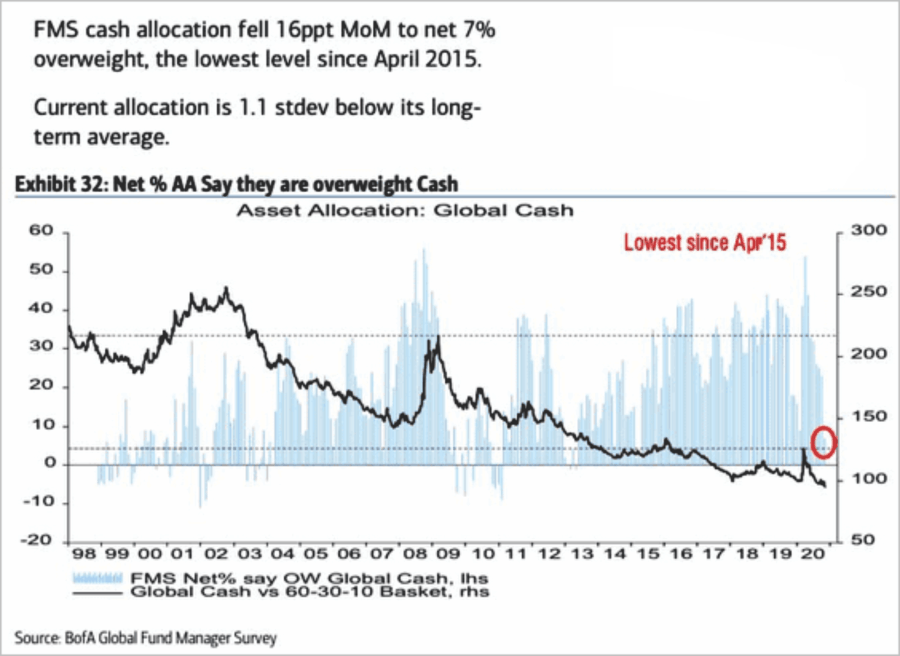
However, while we may undoubtedly experience a pick up in volatility short-term due to distributions, longer-term the markets tend to be “forward-looking.” In theory, the markets are a “discounting mechanism” and start to adjust for expected outcomes.
Overly Optimistic
In this case, the market should be “pricing in” a recovery in economic growth and earnings as a “vaccine” begins to reduce the drag caused by the pandemic. However, with markets at all-time highs, investors have priced in “perfection,” leaving room for “disappointment.”
For example, in Q4-2019, the S&P 500 finished the year at 3230.78, up 27.6% for the year. The basis of the rally was a trade deal (which never occurred,) tax cuts and massive levels of share buybacks. At that time, analysts estimated that reported earnings for the fiscal year 2020 would be roughly $167/share. Investors justified paying 19.35x earnings due to low-interest rates and expected strong economic growth.
Unfortunately, that didn’t occur. Instead, the economy got hit by a pandemic, a recession, and surging levels of unemployment. Nonetheless, due to massive government interventions, the market recovered to trading near all-time highs, up more than 11% for the year.
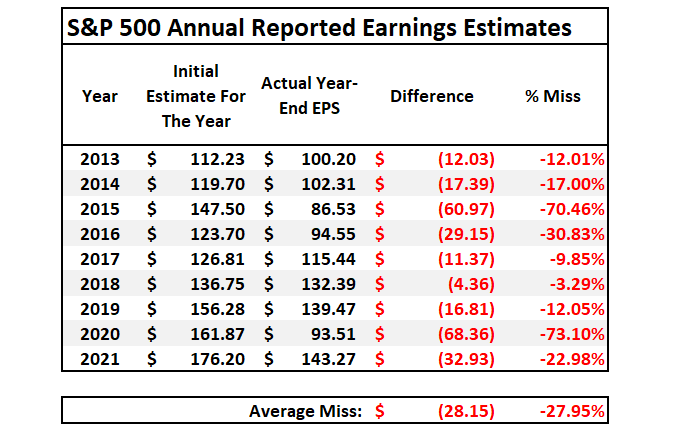
However, earnings for 2020 will not come in at $167/share, but rather closer to $93/share. Such is more than $74 lower than estimated, leaving investors holding assets that have doubled in valuation from 19x to 38x earnings.

Investors are currently rushing into already overvalued assets once again based on expectations that 2021 earnings will rise to $143.09/share. The problem is that while investors chased the market higher, 2021 estimates collapsed by roughly $30/share.

The issue for investors is that historically analysts are roughly 30% too optimistic about the future.
Overly Optimistic
But it’s not just the analysts that are overly optimistic. In the short-term, investors cling to the idea that “fundamentals don’t matter.” Such is not entirely incorrect as “market momentum” is a hard thing to kill. When the “Fear Of Missing Out” overrides logic, the markets can make irrational moves. As noted in this week’s newsletter:
“You have to wonder precisely how much ‘gas is left in the tank’ when even ‘perma-bears’ are now bullish. Therefore, the question we should ask is ‘if everyone is in, who is left to buy?’”
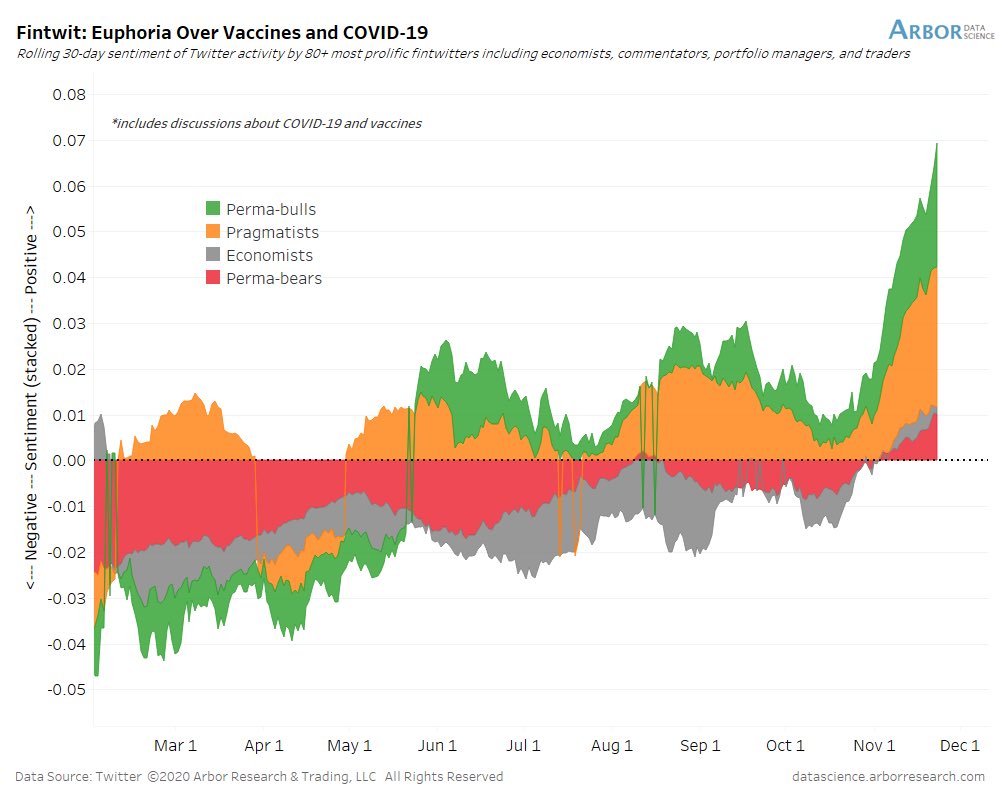
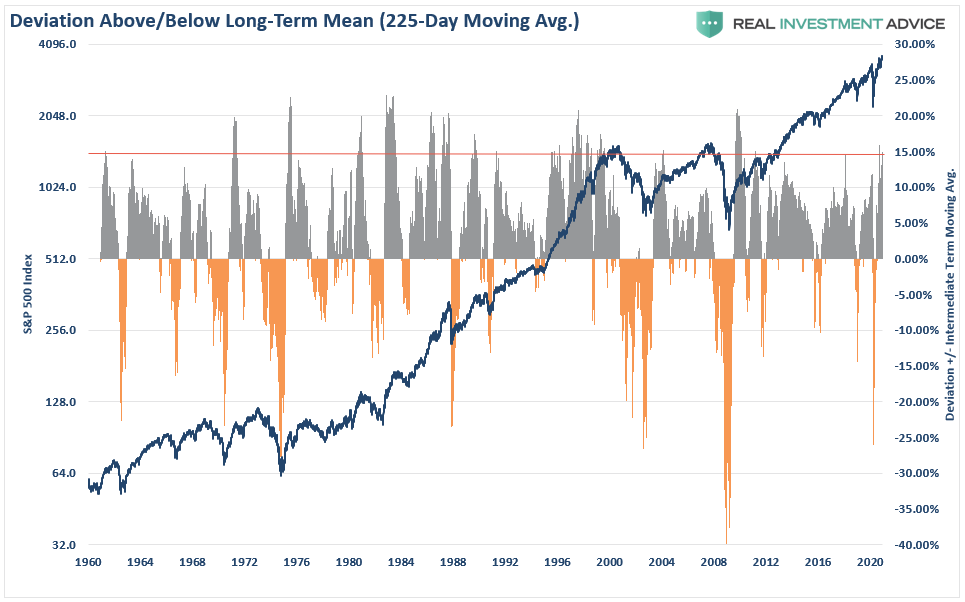
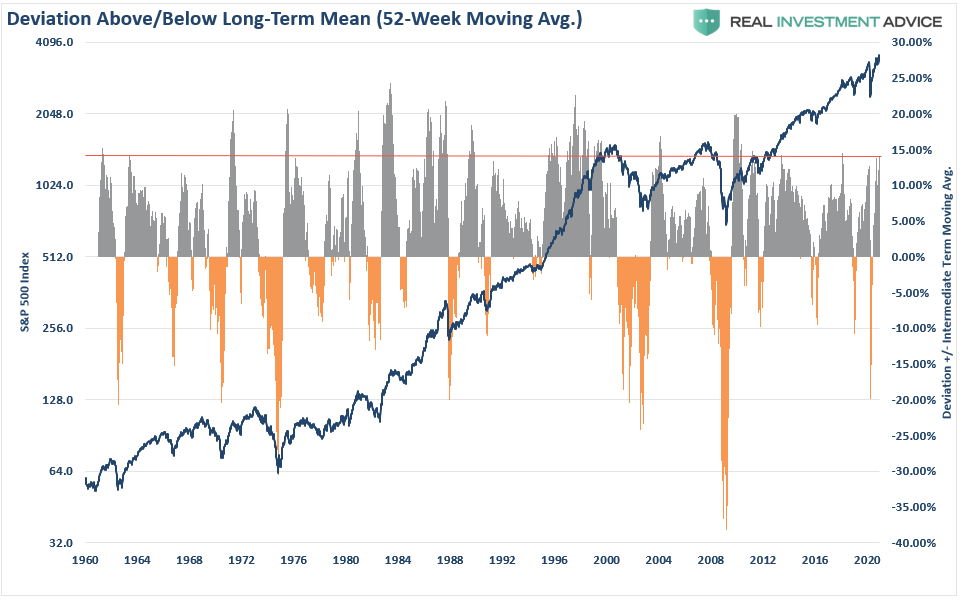
That sentiment has pushed market speculation to more extreme levels, which have historically coincided with short- to intermediate-term corrections. As shown below, over the longer-term, such deviations from long-term means have rarely ended well for investors.
The deviation above the 225-day moving average is now at 15%, which is typically associated with at least short-term market peaks. (Last time was at the September highs)
The 52-week moving average deviation is just slightly below 15%. Such is historically associated with market peaks. (Last time at this level was January 2018, and at 13.5% in February 2020)
On a monthly basis, the deviation is at 17.5% of the 24-month moving average. While we have seen higher levels historically, the market is now in the territory of more meaningful market corrections.
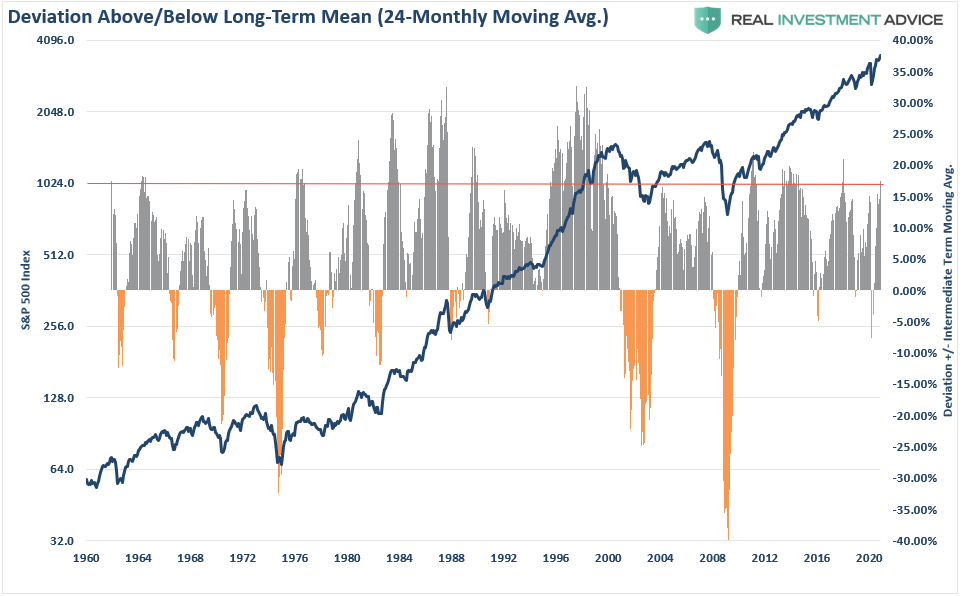
While the markets can certainly go higher from here, the point is that they are unlikely to do so without a correction or consolidation, first.
Bullish Sentiment Abounds
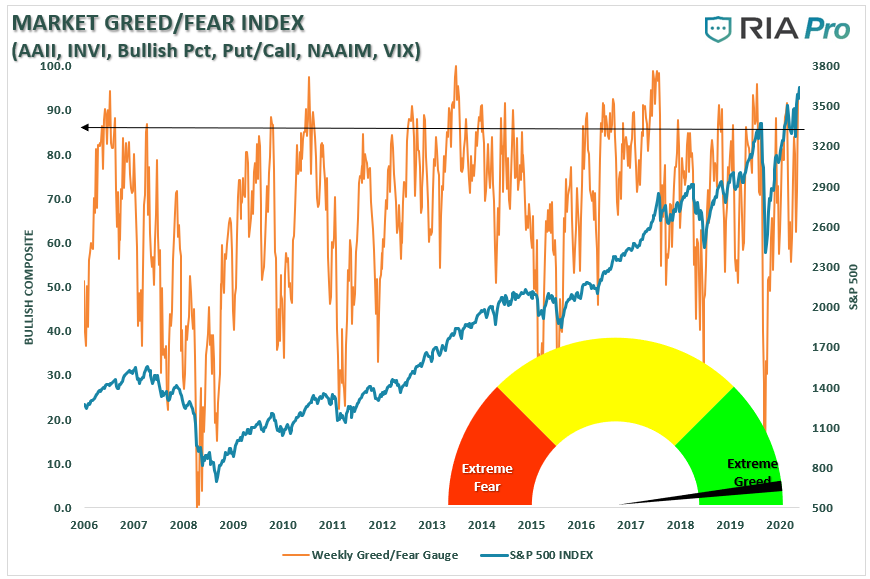
Currently, investor sentiment is about as “bullish” as it can get. We produce a weekly fear/greed index.
The “Fear/Greed” gauge is how individual and professional investors are “positioning” themselves in the market based on their equity exposure. From a contrarian position, the higher the allocation to equities, to more likely the market is closer to a correction than not. (The gauge uses weekly closing data.)
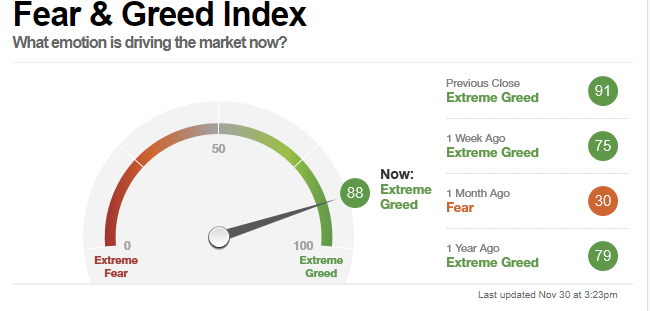
However, even the CNN Fear/Greed gauge is pushing “bullish” levels.
Also, I have rarely seen a period where every sector and market is trading above its relative risk/reward range outside of Utilities. Again, not surprisingly, the deviations from long-term means are also at more historical levels.
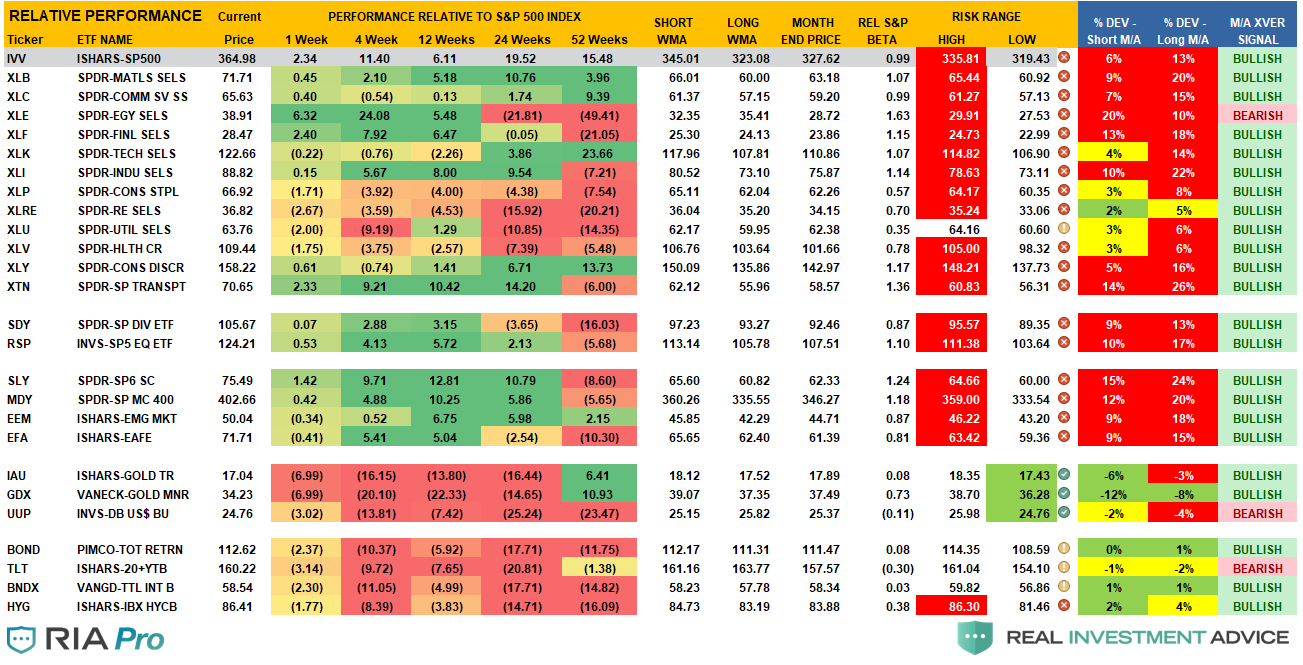
None of this means a correction MUST occur. Much like “gasoline” stored in a tank, it requires a “catalyst” to ignite it.
Lot’s Of Risks To The Bullish Outlook
Many issues could provide such a “spark.”
- The market has fully priced in whatever economic recovery we are likely to see near-term.
- There is clear evidence of weakening economic data and slower earnings growth.
- Investors are counting on a “vaccine” to restore the economy to its previous strength fully.
- The markets have dismissed the negative impact of the economic shutdown.
- Market participants have discounted the need the additional stimulus to sustain economic growth and recovery.
- The Fed is on the sidelines for now. Without additional Treasury issuance, the Fed has less ability to provide additional liquidity to the market.
- While the economy is indeed recovering, along with employment, it will still likely fall well short of pre-pandemic levels stifling future earnings growth and revenues.
- Investors pay exceedingly high valuations based on a full earnings recovery, which is unlikely to be the case.
These are just some broad thoughts. However, when everyone is long equities and leveraged, it is an unexpected, exogenous event, which begins the rush for the exit.
What exactly will that catalyst be? No one knows, just as no one expected the “pandemic” in March.
Whatever the catalyst eventually is, the common refrain will be that “no one could have seen it coming.”
It’s Still A “Sellable Rally.”
The reason we have and continue to suggest selling this rally is that, until the pattern changes, the market exhibiting all traits of a “topping process.”
- Weak participation
- Failure at long-term resistance
- Extreme bullish speculation
- Negative divergences in relative strength
We can show this in a long-term monthly chart.
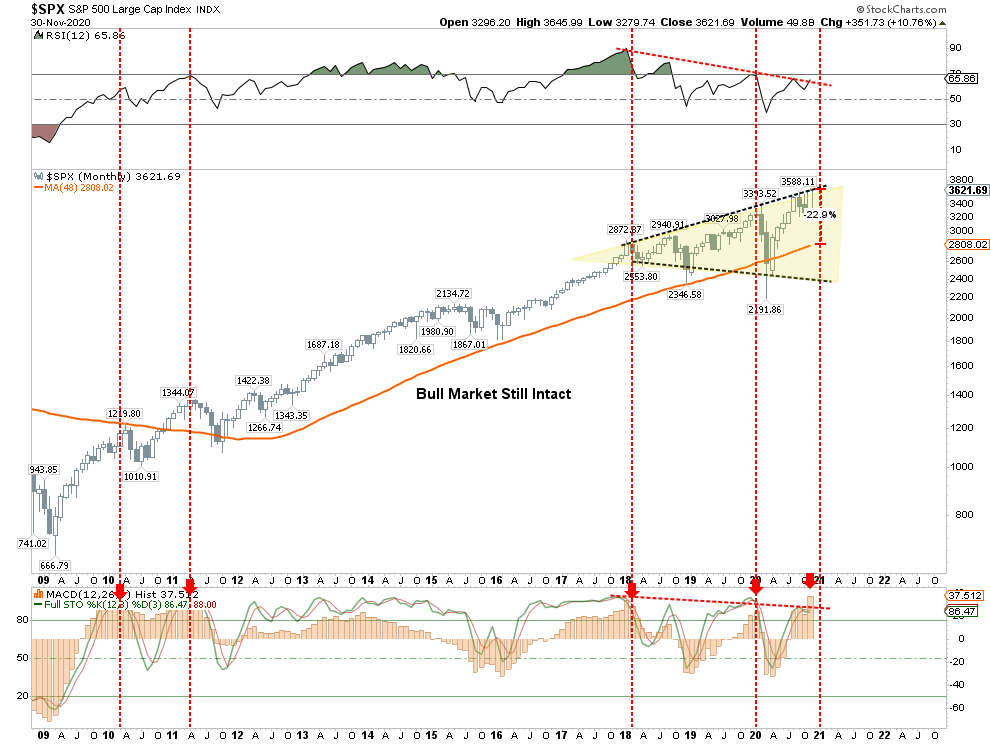
Since 2009, whenever the monthly MACD “buy signal” was this elevated, it typically correlated to a short- to intermediate-term market peak. At each point, the “bullish story” was the same.
- Earnings are still strong.
- Economic data suggests the economy is growing strongly.
- It’s a “Goldilocks Economy”
- The Fed is remaining “accommodative.”
However, the primary warning signs to investors were also the same:
- A failure of the economy to live up to market expectations
- The rise in volatility
- A decline in bond yields.
- A shortfall in corporate profits and earnings
Calculating The Madness
Sir Isaac Newton once said:
“I can calculate the motions of the heavenly bodies, but not the madness of the people..”
As we head into year-end, we will be navigating the risk of overly extended and bullish markets against the seasonally strong end of year period. As discussed in our “3-Minutes” on Monday, we expect a short-term correction over the next couple of weeks as “distribution season” ensues.
However, following that, the annual “Santa Claus” rally into year-end is likely. We will act accordingly and increase equity risk in portfolios as needed.
Such is just how we manage money. We believe that over the long-term, capital preservation and risk management leads to better outcomes.
If you disagree, that is okay.
When the opportunity presents itself, and the “madness has subsided,” these are the questions we will ask ourselves before we add exposure to portfolios:
- What is the expected return from current valuation levels? (___%)
- If I am wrong, given my current risk exposure, what is my potential downside? (___%)
- If #2 is greater than #1, then what actions should I be taking now? (#2 – #1 = ___%)
How you answer those questions is entirely up to you.
What you do with the answers is also up to you.
You have to ask yourself how much of the “narrative” has already gotten priced into the market?
By looking at the data, it would be easy to assume the answer is “much.”
