In this past weekend’s newsletter. I discussed the potential for the market to hit new highs. To wit:
The good news this week is that the market maintained last week’s advance despite the one-day tantrum earlier. Interestingly, since the election, the market has ratcheted higher in slightly more than 3% increments with each move higher followed by a drawn-out consolidation process that runs primarily along the 50-75 dma. The last sell-off tested, and held, the 100-dma but stayed within the confines of the consolidation process. The 2400 level on the S&P 500 remains the clear ‘warning level’ for investors currently.
Chart updated through Monday’s open.
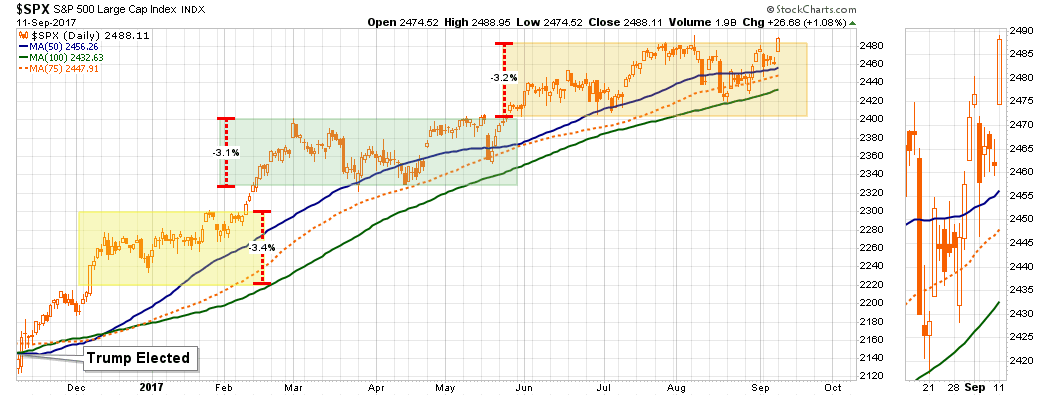
But this short-term bullish backdrop is offset by intermediate-term bearish underpinnings as shown by the next two charts. With an intermediate-term momentum sell-signal in place, combined with overbought conditions, continues to suggest further gains from this point will likely remain limited and more volatile to obtain. That statement DOES NOT preclude the markets reaching new highs, it just suggests that downside corrective risks outweigh the potential currently for further gains.
That “gap up” opening occurred Monday morning as “relief” spread through global markets due to the reduction of geopolitical stress as the U.S. once again “caved” to the threats of North Korea.
Over a month ago on the “Lance Roberts Show,” I discussed North Korea’s real positioning behind their nuclear tests and ICBM launches.
While Kim Jung Un may ‘appear’ to be ‘crazy,’ and he is, he does understand the consequences of starting an actual war with the U.S. However, as a dictator, he can not afford to show weakness. Therefore, he needs the U.S. to acquiesce to some degree to allow him to claim victory over the ‘evil empire’ of the west.
Over the weekend, as per Reuters, that is exactly what happened.
A U.S.-drafted resolution originally calling for an oil embargo on the North, a halt to its key exports of textiles and subjecting leader Kim Jong Un to a financial and travel ban have been weakened, apparently to placate Russia and China which both have veto powers, diplomats said.
And, as I stated would be the case, the spokesman for the Democratic People Republic of Korea quickly claimed:
The world will witness how the DPRK tames the U.S. gangsters by taking a series of actions tougher than they have ever envisaged.
With that, the world breathed a sigh of relief and the previous “risk off” trade rushed to pile back into “risk.”
“How do you spell relief?
“C-E-N-T-R-A-L B-A-N-K-S”
According to BofA’s Michael Hartnett, in 2017 Central Banks have increased purchases of financial assets by roughly $2 Trillion. In turn, this has now pushed global balance sheets from $4.34 Trillion in 2008 (pre-Lehman,) to $15.6 Trillion currently.
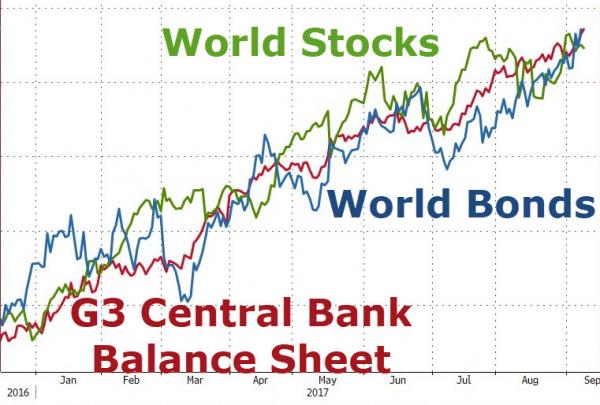
At the same time, this has pushed yields to record lows, and equities to record highs. The problem is that markets have now been “priced to perfection” for future earnings growth and economic expectations. Yet, at the same time stock prices are rising, earnings estimates continue to decline. Via Factset:
During the first two months of the quarter, analysts lowered earnings estimates for companies in the S&P 500 for the third quarter. The Q3 bottom-up EPS estimate (which is an aggregation of the EPS estimates for all the companies in the index) dropped by 1.7% (to $33.26 from $33.84) during this period.
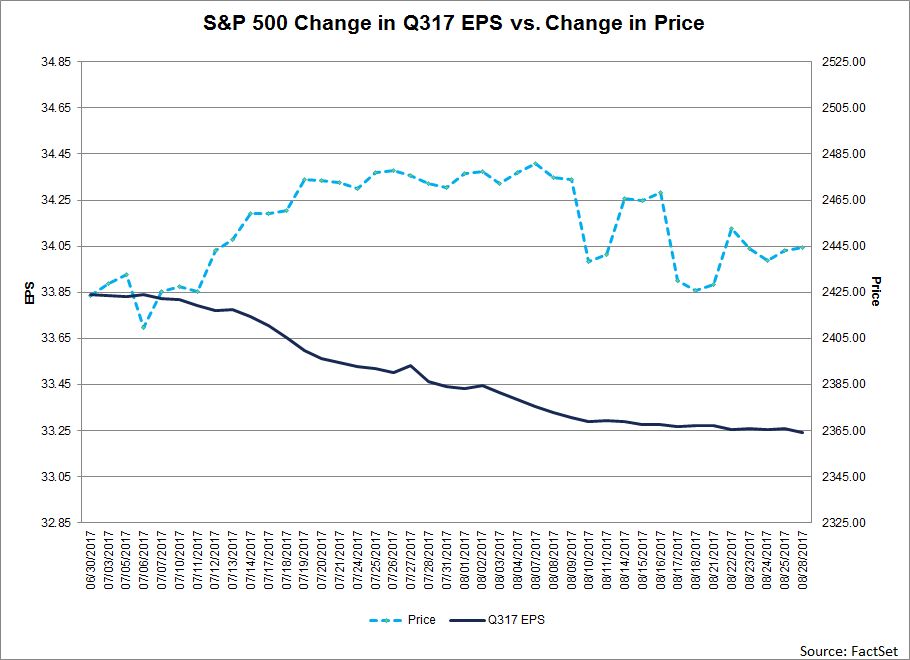
But while FactSet puts a positive spin on the decline, the decline in earnings estimates can be more clearly seen in the chart below. It compares REPORTED EPS from January, July and September 2017, to where estimates were in 2016 for the end of this year.
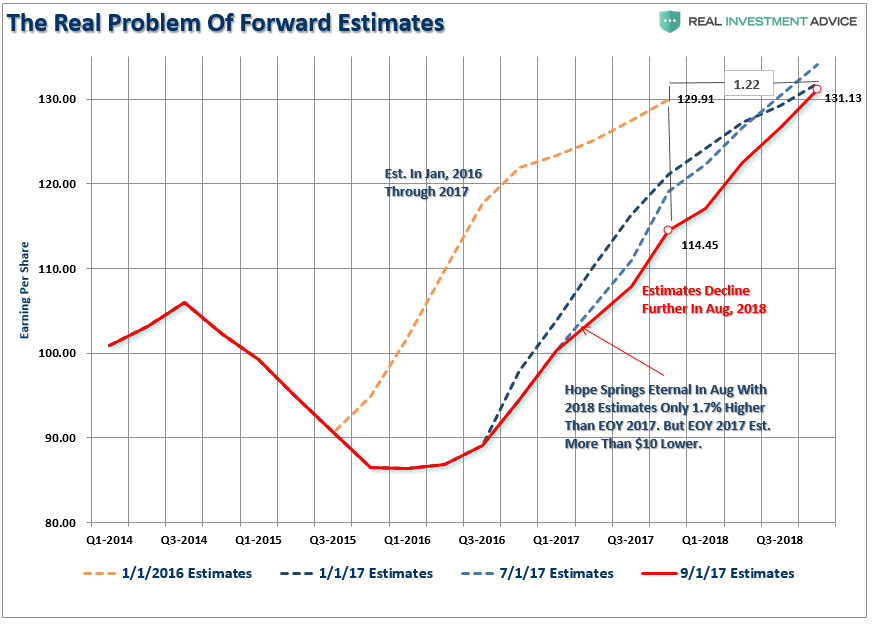
Here is the problem. While the financial markets have risen to “all-time” highs, estimates for 2017 are more than $10 lower than they were in 2016. Furthermore, Q4-2018 estimates are being consistently ratcheted lower and are now only $1.22 higher than where the Q4-2017 originally stood.
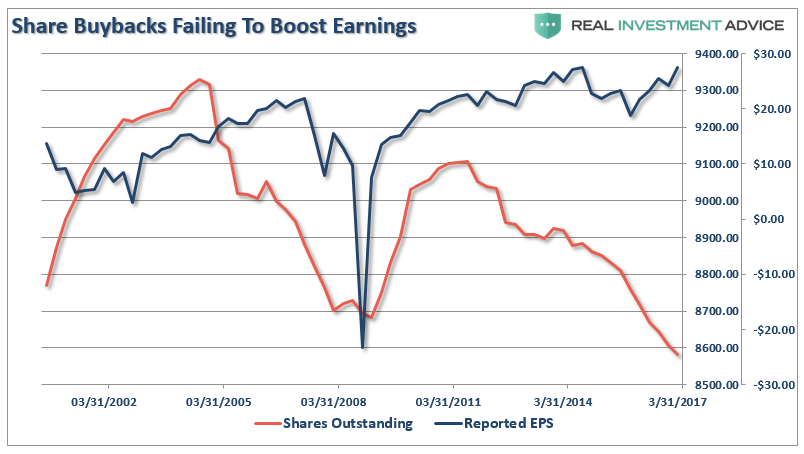
The bigger issue is that the largest driver of earnings per share growth has NOT come from the increase of sales and revenue, but rather through the reduction of shares outstanding. It is worth noting the previous collapse in EPS came not as share buybacks were falling, but when they stopped.
But that is a story yet to play out.
For now, stocks are pricing in forward estimates, and as stated above, have likely “priced in” all of the expected growth going forward.
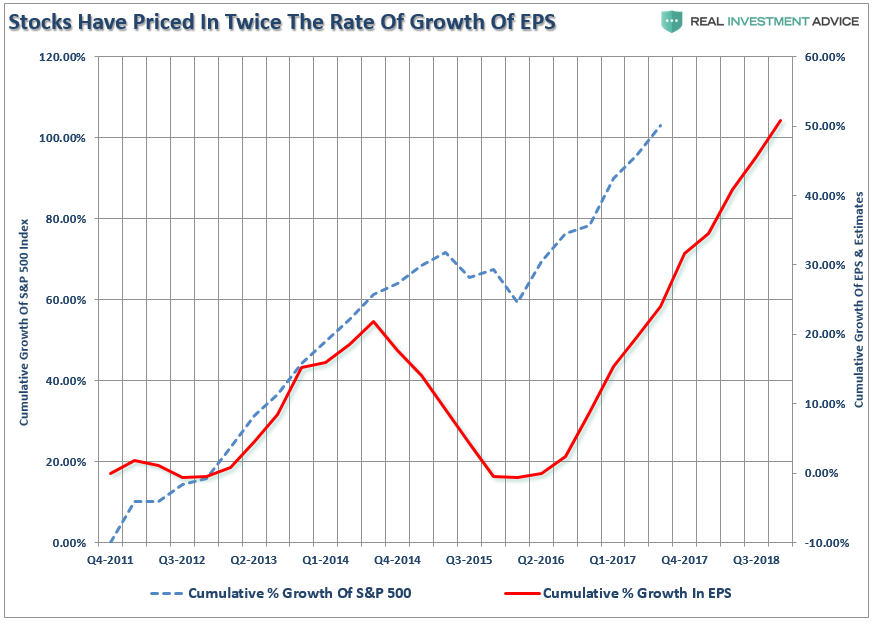
Of course, as it has always been, it will be when expectations fail to become a reality the real problems will begin. It is the same problem that has triggered every “repricing” of assets throughout history.
But this too will be a story for another day.
For now, it remains a market driven by a simple belief that Central Banks can control outcomes. The flood of liquidity into the financial systems are finding their way either indirectly, or directly, into assets driving prices higher. That in turn has fueled investor optimism which has now hit the highest level in 17-years according to the latest Wells Fargo/Gallup poll.
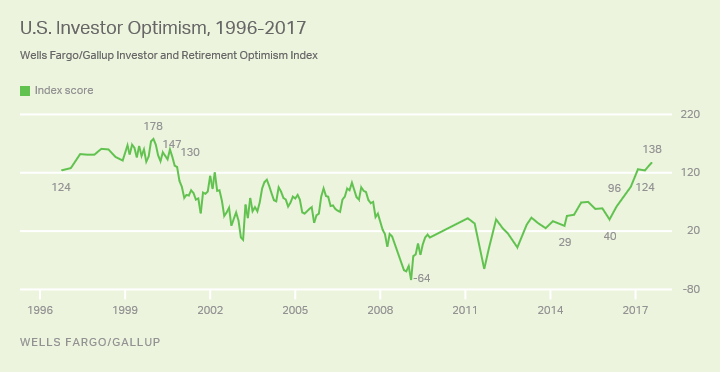
The latest boost in optimism pushes the index almost 100 points higher than the +40 score measured in February 2016. The 98-point hike over the past 18 months is the largest increase in the 20-year history of the index that is not a rebound immediately after a major drop in optimism.
After more than 8 years of a surging bull market, often declared the “most hated in history,”
- Sixty-eight percent now say they are optimistic about the stock market’s performance during the next year, matching the record high for the question from December 1999 and January 2000.
- At least 61% have expressed optimism about the stock market in each of the three surveys this year, a percentage matched or exceeded only four other times in the 132 times the question has been asked since April 2000.
- Twenty-five percent say they are “very optimistic,” topping the previous record high of 24% from the first quarter of this year. Only 11% were very optimistic a year ago.
- Sixty-one percent of investors now say it is a good time to invest in the stock market, up from 53% two years ago. Among those saying it’s a good time to invest, the main reason is their belief that the market will continue to increase, mentioned by 47%.
See, what is there to worry about?
Everyone agrees this is the greatest “bull market” in history.
Of course, that brings me to this little note from Social Capital recently defining a bubble:
But in a bubble, everyone stops worrying about that. Fear of losing capital becomes superseded by a different kind of fear: FOMO. Bubbles give everybody involved a credible reason to believe that follow-on financing will continue to be available, and at more and more attractive rates to boot. Which means, if you’re an investor, hey, we’ve gotta get started now! Hurry, before the price goes up! And if you’re an entrepreneur, Hey, we’ve gotta get started now, before the competition does! That’s what we need to break the coordination failure. Under bubble conditions, we willingly and enthusiastically embark on speculative projects that have no line of sight to positive free cash flow and must continue raising more and more money.
Are we in a bubble? Probably. There are plenty of signs which suggest that is the case.
The next chart shows every major bubble and bust in the U.S. financial markets since 1871 (Source: Robert Shiller)
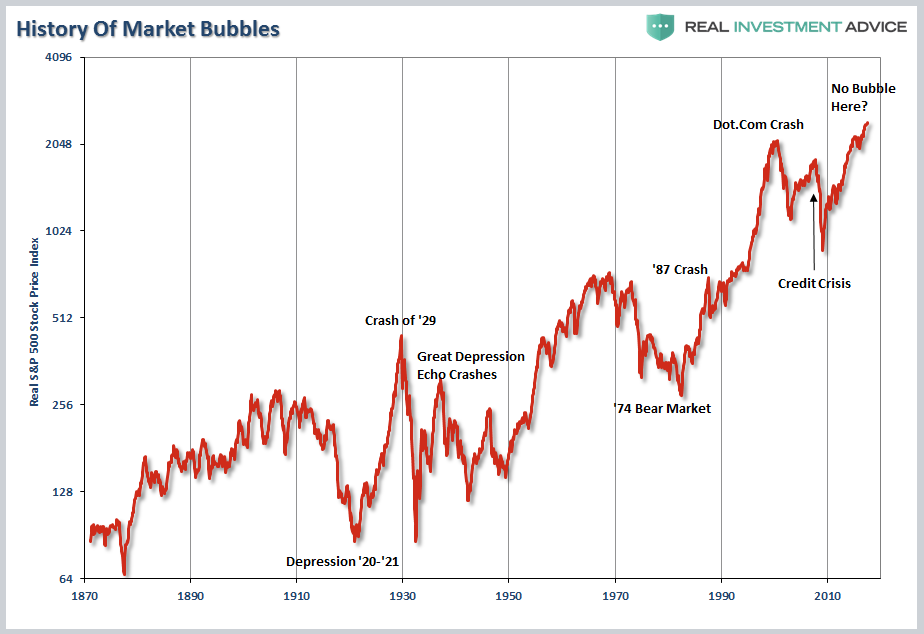
At the peak of each one of these markets, there was no one claiming that a crash was imminent. It was always the contrary with market pundits waging war against those nagging naysayers of the bullish mantra that “stocks have reached a permanently high plateau” or “this is a new secular bull market.” (Here is why it isn’t.)
Yet, in the end, it was something that was unexpected, unknown or simply dismissed that yanked the proverbial rug from beneath investors.
What will spark the next mean reverting event? No one knows for sure, but the catalysts are present from:
- Excess leverage (Margin debt at new record levels)
- IPO’s of negligible companies (Blue Apron, Snap Chat)
- Companies using cheap debt to complete stock buybacks and pay dividends, and;
- High levels of investor complacency.
Either individually, or in combination, these issues are all inert. Much like pouring gasoline on a pile of wood, the fire will not start without a proper catalyst. What we do know is that an event WILL occur, it is only a function of “when.”
The discussion of why “this time is not like the last time” is largely irrelevant. Whatever gains that investors garner in the between now and the next correction by chasing the “bullish thesis” will be wiped away in a swift and brutal downdraft. Of course, this is the sad history of individual investors in the financial markets as they are always “told to buy” but never “when to sell.”
For now, the “bullish case” remains alive and well. The media will go on berating those heretics who dare to point out the risks that prevail. However, the one simple truth is “this time is indeed different.” When the crash ultimately comes the reasons will be different than they were in the past – only the outcome will remain same.
