
Summary
Copper prices have taken a dive since the trade wars heated up.
Comments in the latest ISM Manufacturing survey show that tariffs are dominating the industry -- and not in a good way.
Market valuations are still very stretched.
Doctor Copper isn't happy: because of its ubiquitousness as a raw material, economists often add the adjective "doctor" before the word copper. There is also a strong historical correlation between copper prices and overall economic activity. That's why this weekly chart is causing some traders and economists to raise an eyebrow:

Copper rallied from the end of 2016 to the beginning of 2018; the ETF rose from the lower 20s to the upper 30s. Prices consolidated gains from the 3Q17 to the 1Q18. They're now below the 200-week EMA and are trading right at the 50% Fibonacci retracement level.
This may not be the be all and end all, however. Copper's decline occurred as the trade wars were heating up, implying that, should they cool down, copper will stop selling off.
We're starting to see anecdotal discussion about tariffs and trade policy. Every month's ISM manufacturing index release contains an anecdotal section. The survey uses a single quote to represent what a larger number of respondents are saying or thinking. Here are the screen grabs of this month's comments with the discussion about tariffs circled in red:

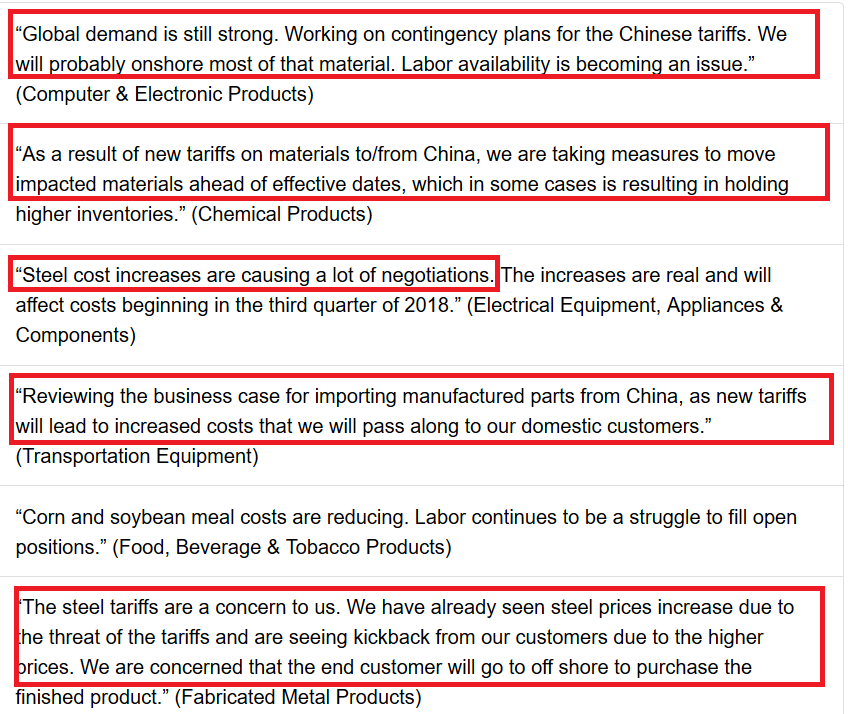
Tariffs are dominating the discussion -- and not in a good way. Prices are increasing; business is looking to change their plans (which will lead to higher expenses); China has stopped taking orders. Here's a general macroeconomic rule: anecdotal information presages hard data. We now have comments from industry participants -- A LOT OF COMMENTS -- that show tariffs are now "the" topic of conversation. If this trend continues, expect to see negative data results in the next 3-6 months.
The market is very expensive: I've carped on the market's valuation on numerous occasions over the last few years and simply wanted to return to my complaining ways. The following two charts are from Advisor Perspectives:
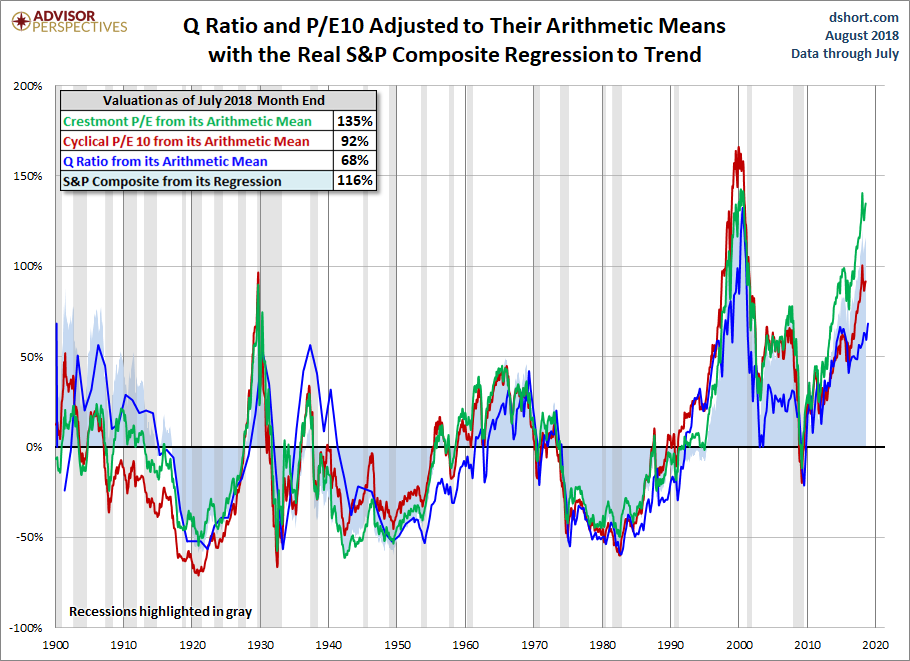
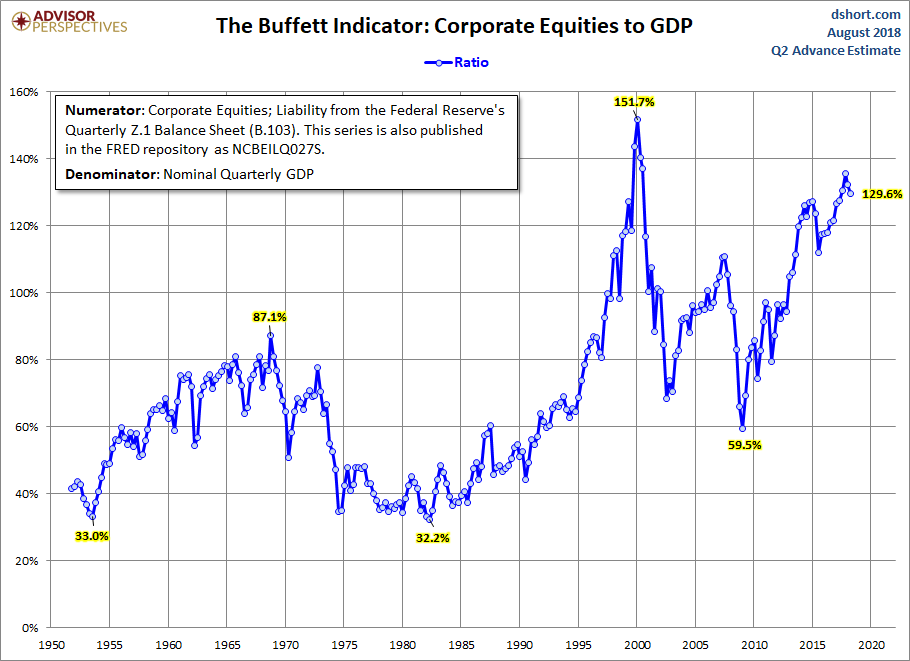
The top chart shows various PE ratios while the bottom chart shows the SPDR S&P 500 (NYSE:SPY) market capitalization to GDP. All are high by historical standards. Think of these indicators like bungee cords: while they'll stretch -- perhaps to extremes -- they will return to lower valuations (think of this as "returning to the mean") at some point.
Turning to the markets, it's been a good earnings season. From Zacks:
Total earnings for the 327 S&P 500 members that have reported Q2 results are up +24.1% on +10% higher revenues. Earnings and revenue growth and the proportion of these 327 companies beating EPS estimates are tracking above other recent periods.
The blended, year-over-year sales growth rate for the second quarter is 9.8% today, which is above the revenue growth rate of 9.3% last week. Positive sales surprises reported by companies in multiple sectors were significant contributors to the increase in the revenue growth rate over the past week. All 11 sectors are reporting year-over-year growth in revenues. Four sectors are reporting double-digit growth in revenues: Energy, Materials, Information Technology, and Real Estate.
And that brings us to the markets. Let's see how various indexes performed this week:

First, notice that everybody did well -- both the equity and bond markets advanced. The PowerShares QQQ Trust Series 1 (NASDAQ:QQQ) had the best week, advancing 1.37%. This was followed by the transports and mid-caps. The SPYs were about a little more than .75%. But, again, this was a positive week.
Over the last week, I've been concerned about two technical issues with the SPYs (see here, here, and here). The first is in the 30-day time period, where prices were forming a rounding top pattern and then consolidating. They have since broken out ... sort of:

Prices were consolidating between the upper 270s and lower 280s. Today they broke out of that range and are now looking for the previously hit levels in the mid-280s.
And then we have the technical issues on the daily chart:

The chart contains a jumble of technical issues. Prices are now below the short-term trend line that lasted most of July. But they're also above the EMAs and using them for technical support. Prices area above the upper 270s, which is providing longer-term support as well. The biggest problem is we're not getting any clear signal from the MACD; it's been giving buy and sell signals over the last few days. The biggest problem is there are an even number of positive and negative developments to choose from. So, take your pick.
Disclosure: I/we have no positions in any stocks mentioned, and no plans to initiate any positions within the next 72 hours.
I wrote this article myself, and it expresses my own opinions. I am not receiving compensation for it (other than from Seeking Alpha). I have no business relationship with any company whose stock is mentioned in this article.