Summary
Trade war tensions are rising, which could potentially hit shares.
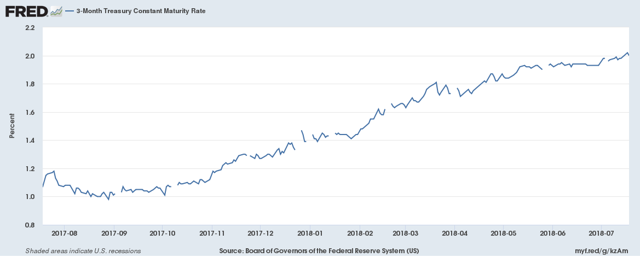
The 3-month Treasury Bill now has a yield above SPY's dividend yield.
The markets had a modest week, performance wise.
You'd think that at some point, I'd grow weary of leading this weekly article off with a discussion about rising trade tensions and the U.S.'s newfound love of tariffs. You'd be right. The level of economic ignorance behind these tariffs cannot be measured by conventional means. Nonetheless, every week we read several news stories that highlight the ongoing trade issues. This week is no exception. The Washington Post had a Finance 101 piece on extended market valuations and how a trade war could not only torpedo asset values (read: sink stock prices) but also shift asset allocations. The article argued that investors are overlooking or ignoring the potential negative fallout from rising trade tensions at their peril. And then on Friday, to throw more fuel on the fire, President Trump told that he was prepared to levy tariffs on all of our Chinese imports. As I've noted many times, recessions are started by shocks, like oil prices increases, bubbles bursting, and, yes, trade wars.
Whoever would have thought that the financial press would be excited about a 2% bond yield - especially when that yield is still below the prevailing rate of inflation? Earlier this week, the Financial Times noted just that in several articles (see here and here). Let's place this development into a visual context. Here's the 3-Month CMT:
Followed by the S&P 500 dividend yield:
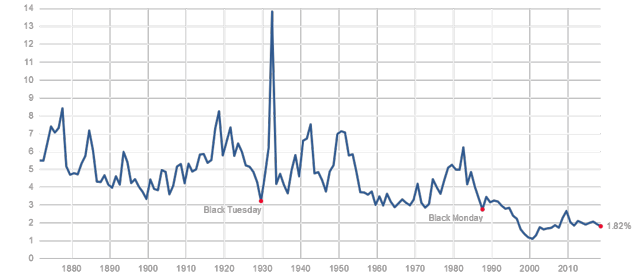
This is actually a very important development. When stock yields were higher than bond yields, dividend-paying stocks were more attractive, which increased demand for these assets. The higher capital appreciation potential associated with stocks increased their attractiveness. But now that dividend yields are below bond yields, we can expect some movement away from stocks and into bonds.
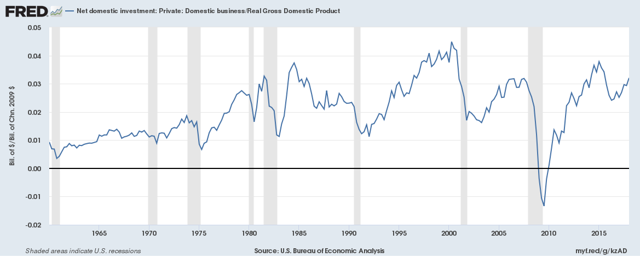
Finally, let's talk about investment - not the kind most people think of when visiting a site like investing.com, but business investment in a physical plant. That number has been improving lately:
And here's a chart of new orders for capital goods excluding aircraft:
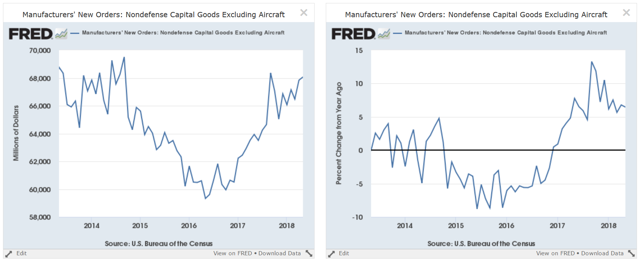
There has been a noticeable pick-up starting in early 2017. But are growing trade tensions impacting corporate sentiment to a high enough degree to force decision makers into slowing their capital plans? Not as of yet; according to the latest Beige Book, all we have right now are concerns. Don't expect that to last forever.
And speaking of the Beige Book, here is that report's analysis of the current US economic situation:
Economic activity continued to expand across the United States, with 10 of the 12 Federal Reserve Districts reporting moderate or modest growth. The outliers were the Dallas District, which reported strong growth driven in part by the energy sector, and the St. Louis District where growth was described as slight. Manufacturers in all Districts expressed concern about tariffs and in many Districts reported higher prices and supply disruptions that they attributed to the new trade policies. All Districts reported that labor markets were tight and many said that the inability to find workers constrained growth. Consumer spending was up in all Districts with particular strength in Dallas and Richmond. Contacts reported higher input prices and shrinking margins. Six Districts specifically mentioned trucking capacity as an issue and attributed it to a shortage of commercial drivers. Contacts in several Districts reported slow growth in existing home sales but were not overly concerned about rising interest rates. Commercial real estate was largely unchanged.
That's a pretty solid macroeconomic backdrop that's translating into stronger earnings. From Zacks:
• Total earnings for the 48 S&P 500 members that have reported Q2 results are up +23% on +10% higher revenues. The proportion of these companies beating EPS and revenue estimates is tracking above other recent periods...
• For the S&P 500 index as a whole, total Q2 earnings are expected to be up +20.4% from the same period last year on +8.3% higher revenues, with 11 of the 16 Zacks sectors expected to have double-digit earnings growth.
Let's turn to the markets, beginning with the weekly performance:

The transports (of all indexes) had the best performance, followed by the Russell 2000. The reason for the latter is that small-cap stocks derive more of their sales domestically. All the other indexes were either up or down modestly.
Let's turn to the main charts, although there is little difference over the last week:
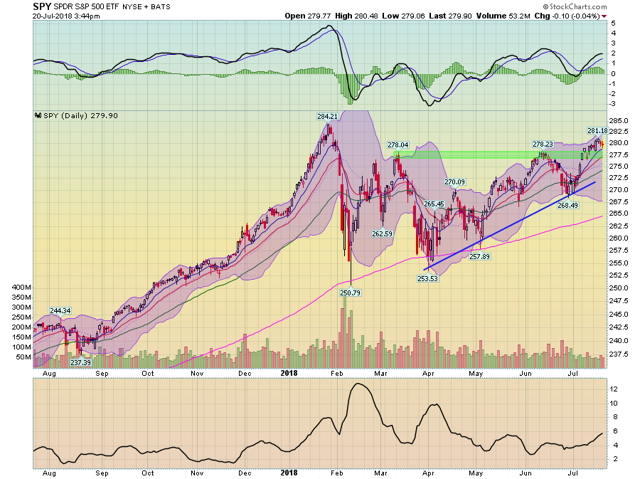
The SPDR S&P 500 (NYSE:SPY) is still above key resistance in the upper 270 range. All the EMAs are moving higher and momentum is positive. Prices just didn't do much this week. However, there is still a clear shot to the mid-280s, which is where the yearly high resides.
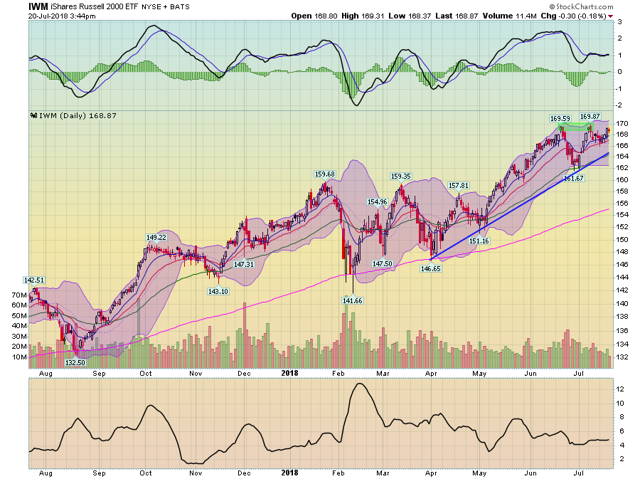
The iShares Russell 2000 (NYSE:IWM) remains at/near yearly highly. Technical developments (EMAs and the MACD) support an additional move higher.
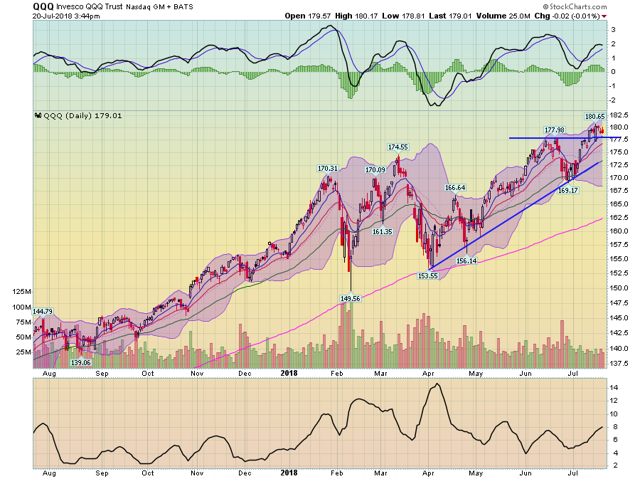
The PowerShares QQQ Trust Series 1 (NASDAQ:QQQ) remain at/near yearly highs as well.
I can't help but feel a bit more on the edge this week. It seems as though the economy moved closer to an edge than we'd like to admit. I could be wrong (and I hope I am), but I just can't shake that feeling.
Disclosure: I/we have no positions in any stocks mentioned, and no plans to initiate any positions within the next 72 hours.
I wrote this article myself, and it expresses my own opinions. I am not receiving compensation for it (other than from Seeking Alpha). I have no business relationship with any company whose stock is mentioned in this article.
