Summary
- Despite the Treasury market sell-off, the yield curve is still pretty narrow.
- The junk bond market is still trading really well.
- It's possible that the markets could be bottoming.
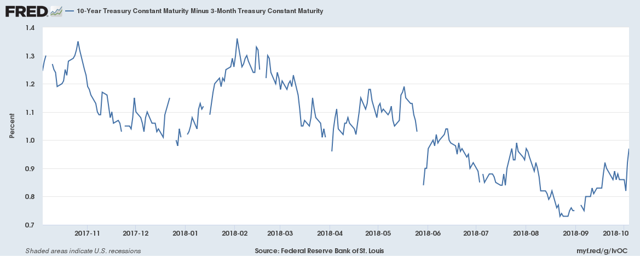
One of the really nice things about the 10–year Treasury selling off is that we haven’t seen a plethora of stories predicting doom because of the narrowing yield curve. Despite the selloff, however, the yield curve is still pretty narrow:
The 10-year Federal Funds spread narrowed to about 75 basis points in September. With the Treasury market selling off, the spread is now approaching 100 basis points. You can make an argument that 15 basis points is a meaningful move. But it’s a very weak argument. At the end of day, the yield curve is still hovering around 100 basis points which is still narrow by historical standards.
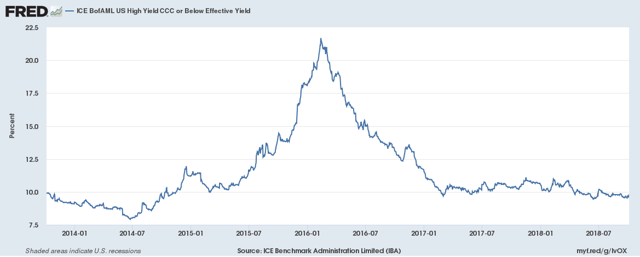
So long as we’re looking at the fixed income market, let’s take a look at junk bonds:
The CCC bond market - better known as junk - is trading really well right now. Part of this is due to the still very low level of Treasury yields and higher-grade corporate paper. Strong corporate profits also support the junk market because it means companies can make their interest payments - however high. This also shows that a high degree of confidence still exists about the economy among junk bond traders.
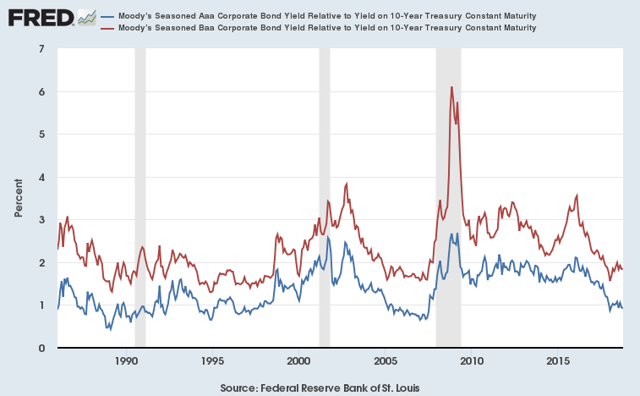
And let’s finish the opening three paragraphs with … an observation about the bond market! The Aaa and Baa spreads relative to the corresponding 10-year Treasury bond are still very low:
At this stage of the game, you would expect these two markets to be trading very well. The economy is strong, corporate profits are high, and investor sentiment is bullish. It’s just nice to know this section of the market that is supposed to be trading well, is.
Before looking at the performance table, let’s review where we are. The Russell 2000, mid–cap, and micro–cap indexes all sold off last week. These indexes had been performing poorly while the S&P 500 was making new highs, undercutting the strength of the larger-cap rally. On one hand, the selloff could be healthy, indicating traders are simply taking profits after an extended rally. On the other hand, the S&P 500 could simply be following other global equity markets lower, which would have a negative economic connotation.
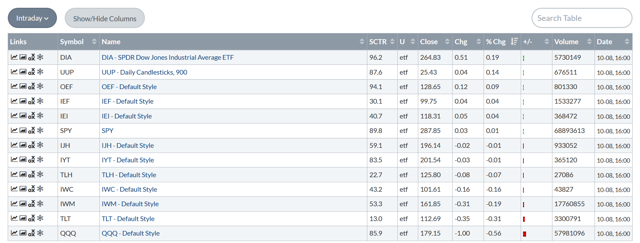
That being said, here is today's performance table:
The good news is that there was not a large selloff. Instead, the overall performance was middling. Indexes composed of larger companies did fairly well in relative terms. The NASDAQ was the worst performer. Also note that the Russell 2000 and micro-caps did not sell off nearly as sharply as last week. We might be able to argue that today the bleeding stopped. Before looking at today’s charts, let's set some analytical ground rules. What we’re looking for is any information that shows that the market is either done selling for now or is set to continue moving lower.
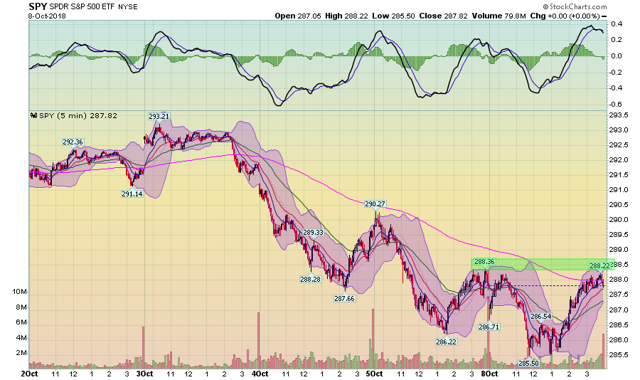
Let's start with the 5-day, 5-minute charts of the iShares Russell 2000 (NYSE:IWM), iShares S&P Midcap 400 (NYSE:IJH), and SPY (NYSE:SPY):
All three indexes ran into resistance at key price levels: 162 for the IWMs, 196 for the IJHs, and 288 for the SPYs. This was also where the 200 minute EMA was located for each moving average. Ideally, we'd like to see each move through each area of resistance.
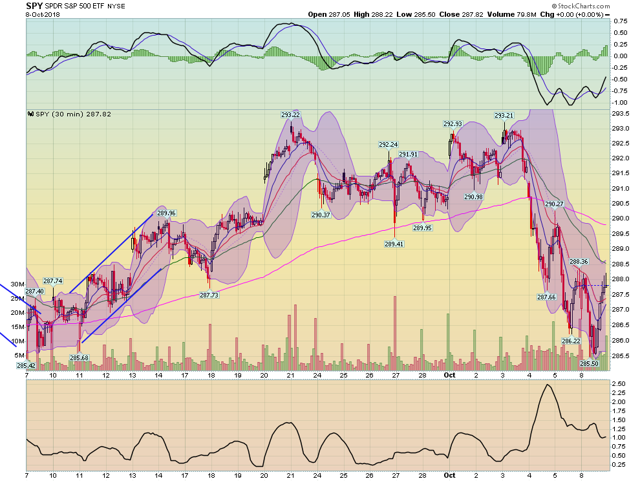
Let's next look at the 30-minute charts:
It's possible that all three are forming double bottoms. Remember that a double bottom doesn't have to be at exactly the same level; proximity is the key.
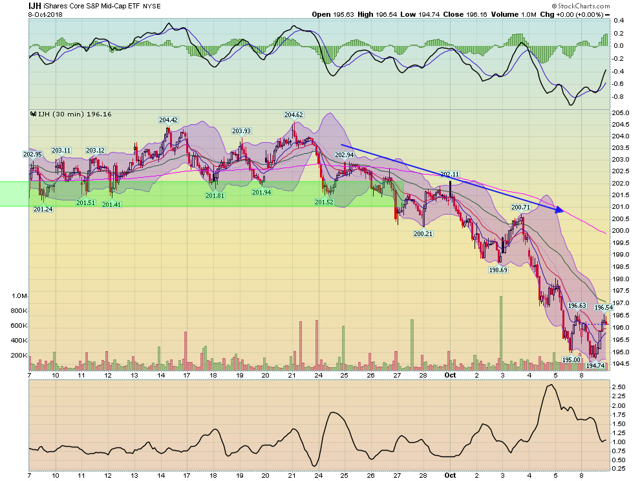
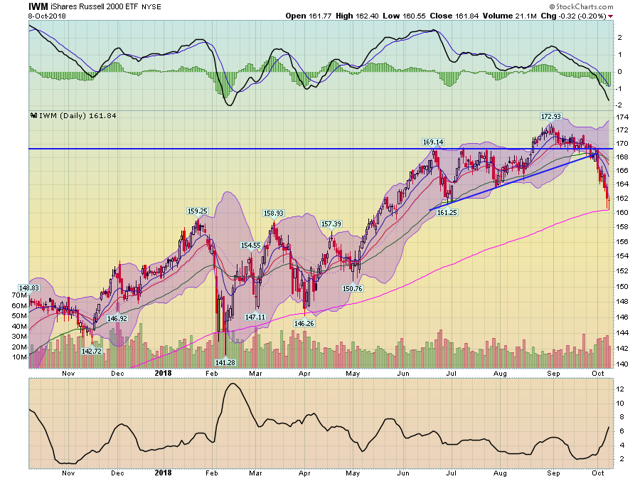
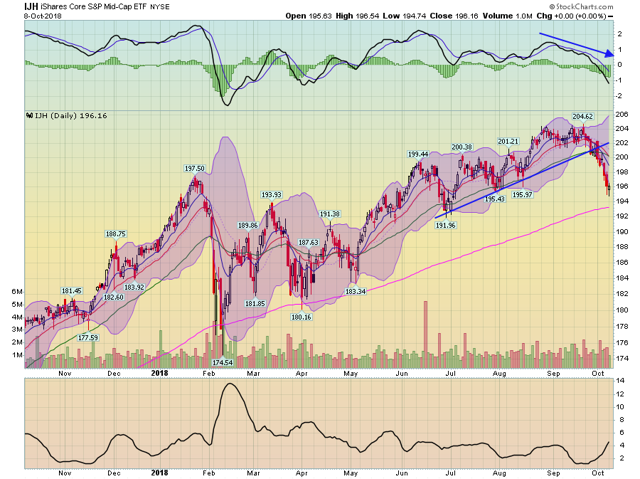
The IWM and IJH daily charts also show potential bottoming:
The IWM has printed a star -- a very narrow candle -- that means there was every little price movement today.
The IJH actually had a small rally.
It's possible that in multiple time frames we're seeing evidence that the sell-off is slowing. However, this is a delicate situation. Ideally, we'll need more time and more information to make the final determination.
Disclosure: I/we have no positions in any stocks mentioned, and no plans to initiate any positions within the next 72 hours.
I wrote this article myself, and it expresses my own opinions. I am not receiving compensation for it (other than from Seeking Alpha). I have no business relationship with any company whose stock is mentioned in this article.

