Summary
- The ISM Manufacturing Index contracted for a second month.
The ISM Manufacturing Index contracted for a second month. The headline number fell to 47.8; new orders, production, and employment all contracted for a second month as well. Only three industries were expanding. Most concerning were some of the anecdotal comments (emphasis added):
- “Continued softening in the global automotive market. Trade-war impacts also have localized effects, particularly in select export markets. Seeing warehouses filling again after what appeared to be a short reduction of demand.” (Chemical Products)
- “Business outlook remains cautious. Orders seem to be decreasing, but luckily not as sharp of a decrease as we were expecting.” (Transportation Equipment)
- “Chinese tariffs going up are hurting our business. Most of the materials are not made in the U.S. and made only in China.” (Food, Beverage & Tobacco Products)
- “General market is slowing even more than a normal fourth-quarter slowdown.” (Fabricated Metal Products)
- “Demand softening on some product lines, backlogs have reduced, and dealer inventories are growing.” (Machinery)
- “Business has been flat for us. Year-over-year growth has slowed dramatically.” (Miscellaneous Manufacturing)
These show a sector that is starting to increasingly hurt as the trade war's damage spreads.
The WTO lowered its global trade growth projection for the next few years (emphasis added):
Escalating trade tensions and a slowing global economy have led WTO economists to sharply downgrade their forecasts for trade growth in 2019 and 2020. World merchandise trade volumes are now expected to rise by only 1.2% in 2019, substantially slower than the 2.6% growth forecast in April. The projected increase in 2020 is now 2.7%, down from 3.0% previously. The economists caution that downside risks remain high and that the 2020 projection depends on a return to more normal trade relations.
This weakness has been more than obvious in the Markit Economics PMI reports released monthly. This development shouldn't be surprising; it's been on the economic horizon for the last 6-12 months.
The RBA lowered rates 25 basis points to 0.75. Trade concerns played a role in the cut:
While the outlook for the global economy remains reasonable, the risks are tilted to the downside. The US–China trade and technology disputes are affecting international trade flows and investment as businesses scale back spending plans because of the increased uncertainty.
The RBA joins a number of other banks around the globe that are pre-emptively lowering rates to stave off the negative effects of the global trade slowdown.
In early September, the markets rallied, led by micro, small, and mid-caps -- sectors that languished during the Spring rally when large-cap equities led the way higher. The smaller-cap indexes all hit key levels and then started to move lower in a disciplined way, potentially indicating a simple, disciplined selloff.
That ended today.

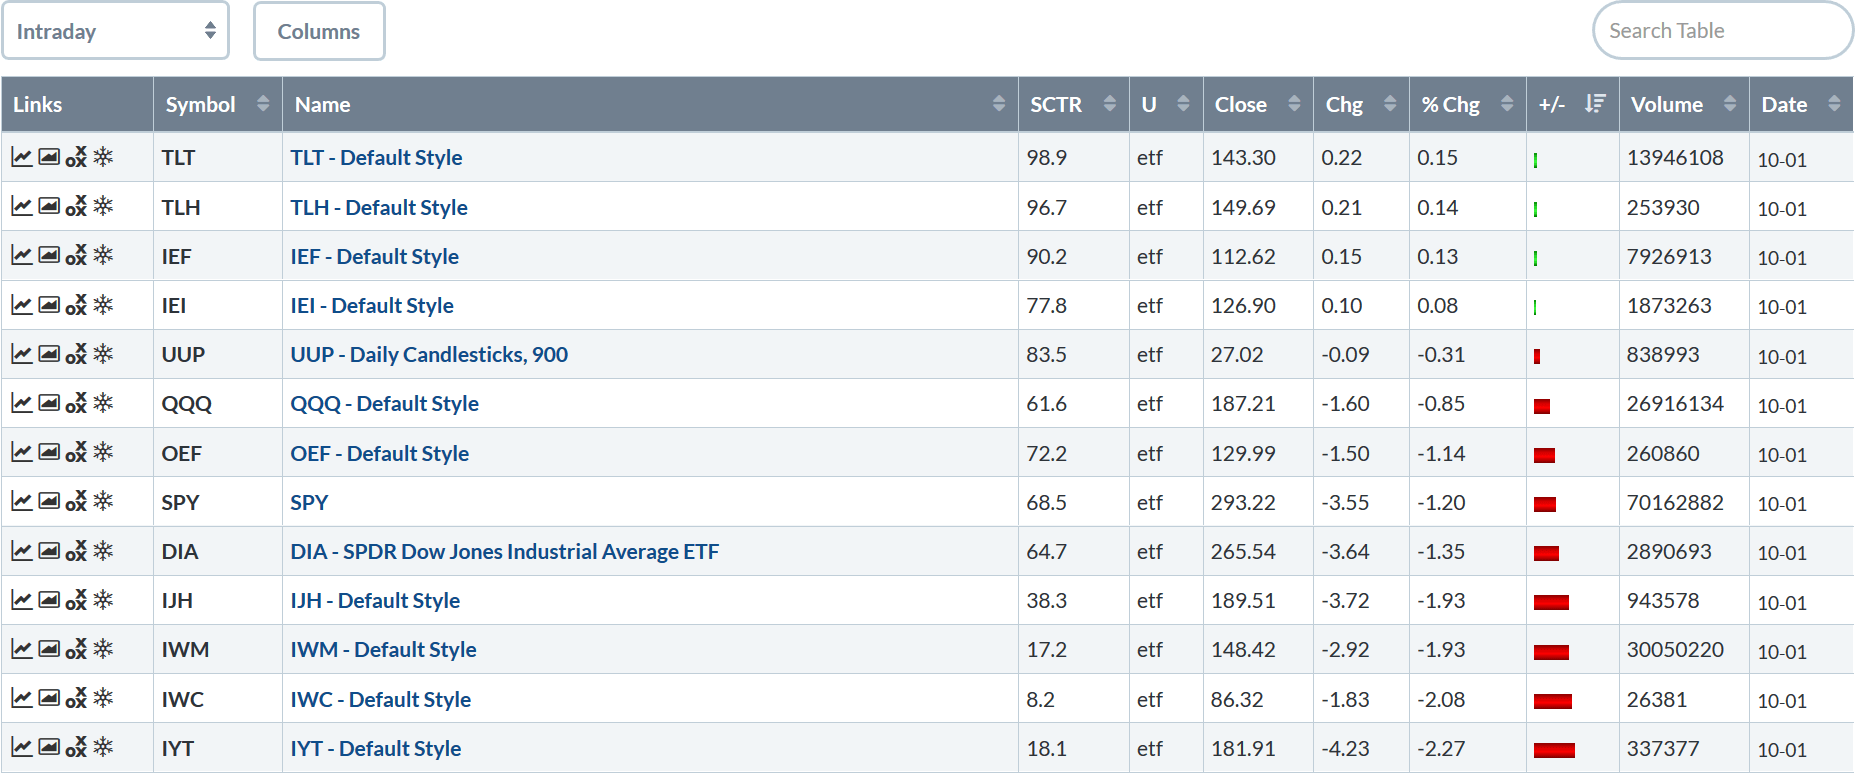
The transports are at the bottom; they fell over 2%, as did the micro-caps. Small and mid-caps were also down sharply, each also falling almost 2%. Larger-cap indexes were also off. The only sector to do "well" was the Treasury market, where the long end gained marginally.
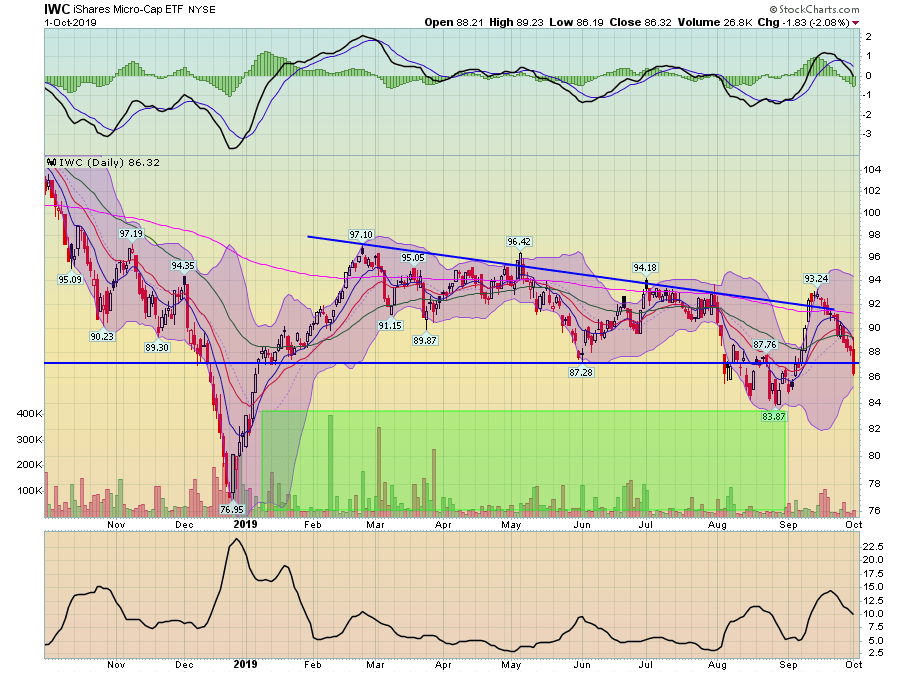
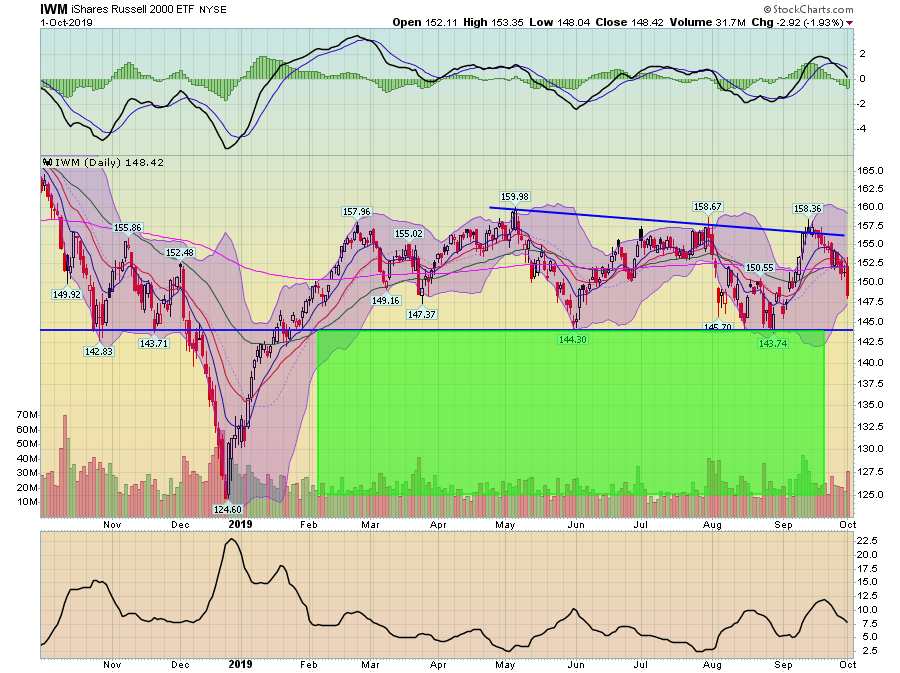
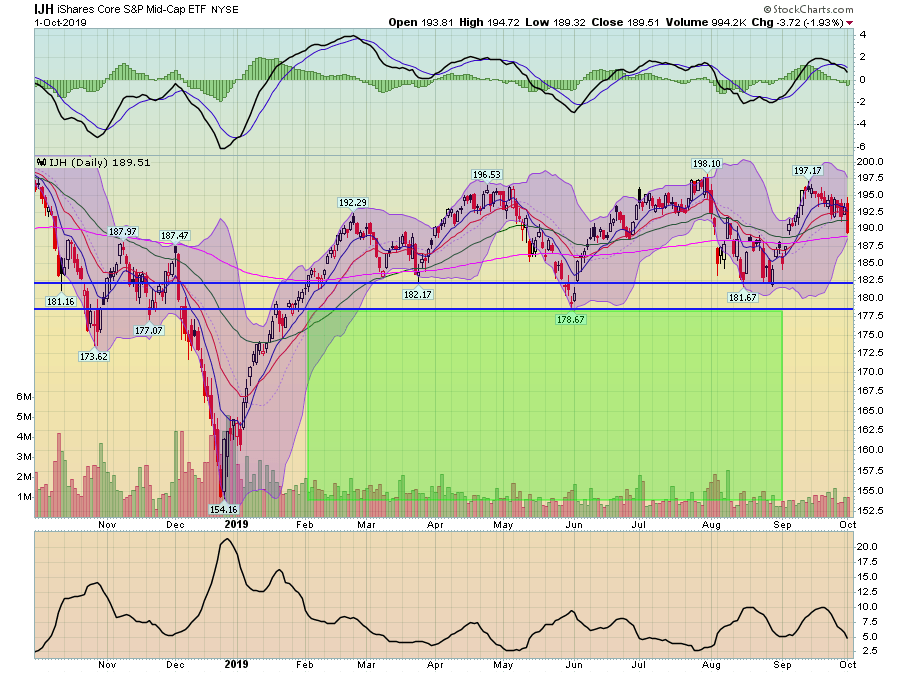
The charts for the smaller-caps indexes are now bearish:

Micro-caps are now below levels from late May/early June. The pace of today's selloff was very strong, indicating increasing downside pressure. The only thing missing from this chart is a large volume spike.

Small-caps, however, had a large spike in volume, although prices are still above key levels of support.

Mid-caps are still above the 50-day EMA. But they, too, had a big day lower.
Until today, technicians could argue there was the possibility of a return to recent highs. Today went a long way towards eliminating that possibility.
