
Technically Speaking For May 7
Summary
- Chinese Market data shows some improvement; EU Markit data is positive, but a bit weaker.
- Today's JOLTs release indicates the labor market is very strong.
- It looks like we're starting a correction.
Markit released the latest round of PMI data. The best part of the release was China's composite PMI reading increasing 2.7 points to 52.7. While manufacturing is still barely positive (50.2), services increased from 0.1 to 54.5. It appears that China's stimulus measures from 2018 have helped to revive the economy somewhat. The EU composite was down 0.1 to 51.5. Manufacturing remains weak; new orders and production were both down. Services, however, expanded. Several of the reports from the "big four" (Germany, Spain, France, and Italy) reported that domestic demand was responsible for the increase in new orders; several reports noted that export orders are still contracting. EU data still indicates the region is expanding but there remains an uncomfortable level of softness.
The RBA maintained rates at 1.5%. Because Australia is more export-dependent, its central bank usually comments on international economic conditions. Here is its latest analysis (emphasis added):
The outlook for the global economy remains reasonable, although the risks are tilted to the downside. Growth in international trade has declined and investment intentions have softened in a number of countries.
This observation agrees with the export observations contained in the PMI releases above. The latest round of proposed tariff increases obviously adds to the downward tilt of potential outcomes.
Today's JOLTs released confirms that the job market is very strong.
The number of job openings rose to 7.5 million on the last business day of March, the U.S. Bureau of Labor Statistics reported today. Over the month, hires and separations were little changed at 5.7 million and 5.4 million, respectively. Within separations, the quits rate was unchanged at 2.3 percent and the layoffs and discharges rate was little changed at 1.1 percent.
Here's a key chart of the data:
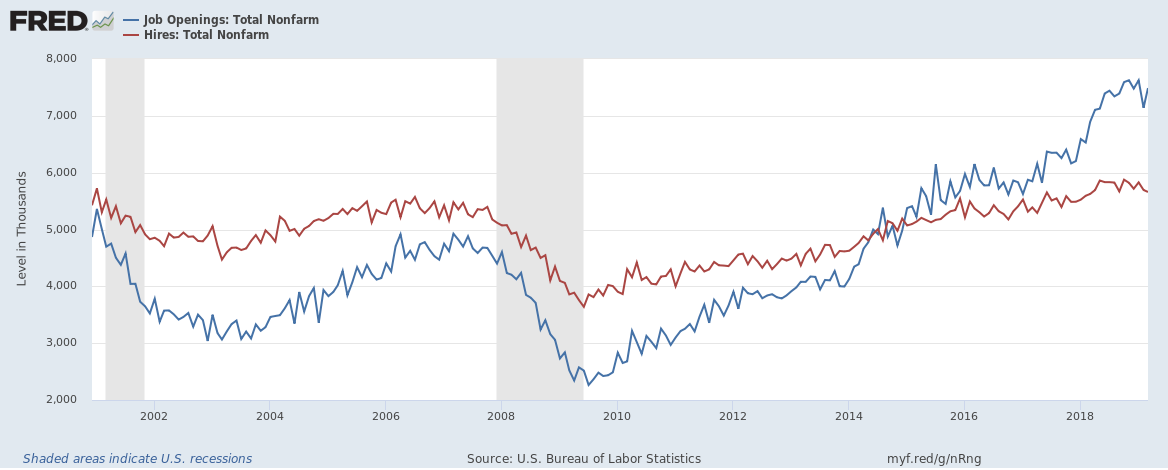
The total number of openings (in blue) rose above total hires in the 1H14. Openings continue to rise, indicating employers are having increasing difficulty finding appropriate candidates.
The quit rate also highlights the strength of the labor market:
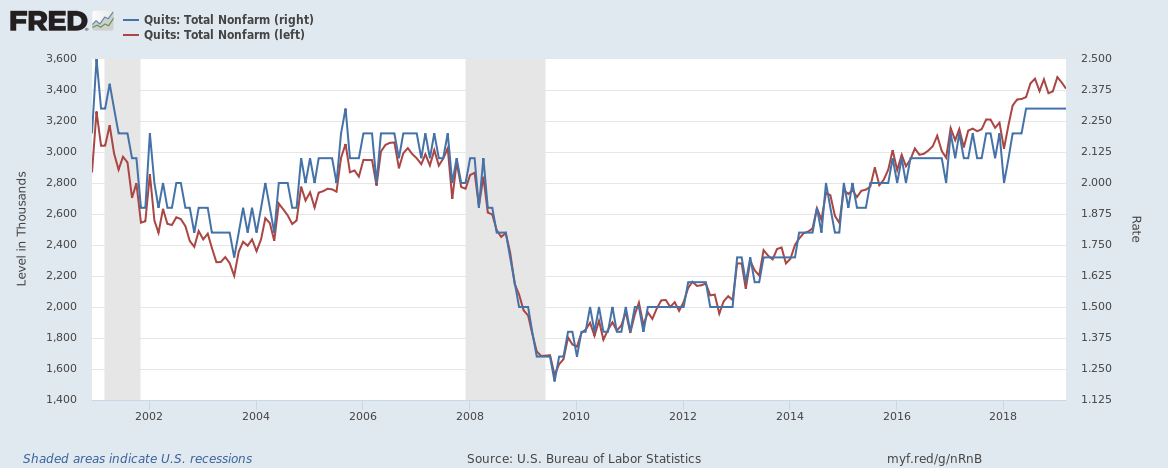
The above chart shows the total number of quits (red, left scale) and level (blue, right scale). Both are near their respective highest level for this data series.
My recent market thesis is that the markets are "toppy" (see here). The Treasury market is rallying, which usually occurs at the end of an expansion when fixed-income investors think growth will slow. Large-caps have rallied while micro, small, and mid-caps have languished. It appears the administration's announcement that it will impose additional tariffs on Chinese goods has provided a catalyst for the large-cap selloff to start. I should caution that we're only two days into the week, so we could see a reversal. But there have been enough bearish developments to make a preliminary call.
Let's start with the Treasury market:

Above are 6-month charts of all the major ETFs that track the entire Treasury market. All are still near 6-month highs.
Small-caps are still having trouble making any advances:

Micro-caps have traded sideways for the last two months. They have tried to advance above 95.71 level three times, only to fall back. Momentum is positive but weak.
Small-caps advanced above the 159 level a few days ago. But today's action took prices below that level again.

The mid-caps have traded below the 198 level for the last month. Today's candle dropped prices to their lowest level in a few weeks. And momentum is moving lower.
Above, we see a general trend: the smaller the companies comprising the index, the more likely that index was to move sideways rather than rally. At the same time, large-caps were rallying ... until the last few days.
Large-caps have clearly broken trend; prices are now below the 10 and 20-day EMA.

The QQQ - which had been the best performing index by far - has also broken its trend, and is sitting at the 186.66 level for technical support. There's been a slight uptick in volume and the MACD has started to move lower.

The SPY broke trend as well on much higher volume. The MACD is also moving slightly lower.
As I mentioned above, we still have three trading sessions left in the week, so the overall tone could change. But the markets have been in a difficult position for the last few months - large-caps were rallying while small and mid-caps were moving sideways. That's just not a sustainable market dynamic. It seems as though the China trade news is providing the selling catalyst that has been lacking until now.
Disclosure: I/we have no positions in any stocks mentioned, and no plans to initiate any positions within the next 72 hours. I wrote this article myself, and it expresses my own opinions. I am not receiving compensation for it (other than from Seeking Alpha). I have no business relationship with any company whose stock is mentioned in this article.