Summary
- Chairman Powell's testimony was viewed as somewhat bearish.
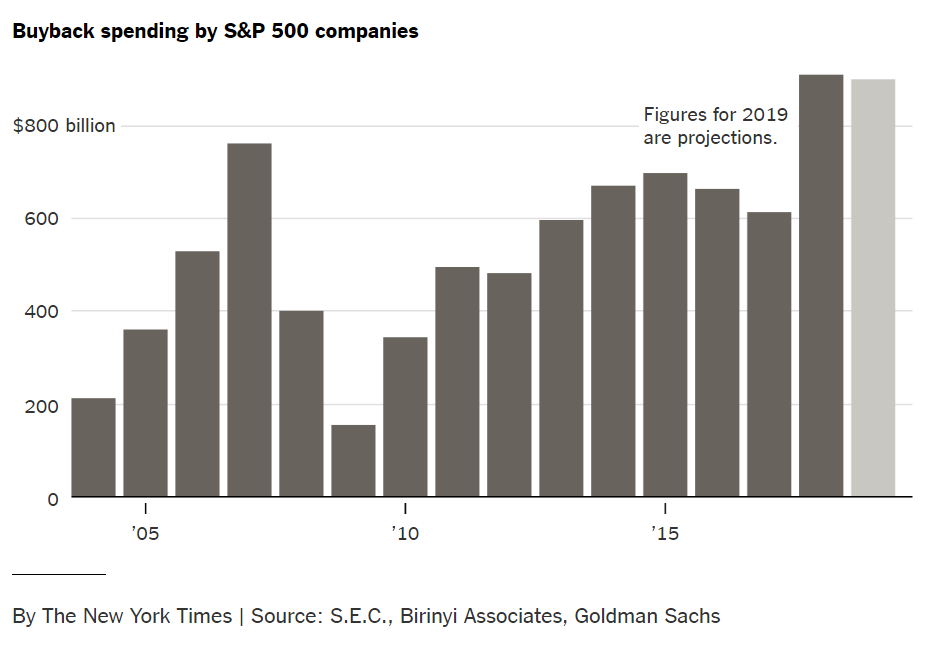
- Share buybacks have had a disproportionate impact on the market.
- Trading was weak for a second day. It's starting to feel like we could be moving into a correction.
Fed Chairman Powell on risks to economic growth (emphasis added):
While we view current economic conditions as healthy and the economic outlook as favorable, over the past few months we have seen some crosscurrents and conflicting signals. Financial markets became more volatile toward year-end, and financial conditions are now less supportive of growth than they were earlier last year. Growth has slowed in some major foreign economies, particularly China and Europe. And uncertainty is elevated around several unresolved government policy issues, including Brexit and ongoing trade negotiations. We will carefully monitor these issues as they evolve.
Financial markets are leading indicators, which makes last year's selloff a potential harbinger. EU and Chinese data continue to weaken; the news around Brexit -- an event that screams "unintended consequences" -- continues to be confusing.
Are share buybacks a primary reason for the latest stock market rally? An article in today's NY Times makes a compelling argument they're at least partially responsible (emphasis added):
In the fourth quarter last year, American companies bought an estimated $240 billion of their own shares, according to an analysis by the Goldman Sachs (NYSE:GS) team that handles stock buybacks for major companies. That’s nearly 60 percent higher than during the same period in 2017.
The article contained the following graphic which shows a large increase in corporate activity since the Great Recession:
Personally, I've always preferred dividend payments, largely because I like cash. But there's no denying that buybacks create a floor for share prices, limiting downside moves and adding fuel to rallies.
I am normally not a big fan of the Chicago Fed's National Activity Index, which tries to blend far too many indicators into a single data point. But the latest report contained a sharp drop in its production component (emphasis added):
The contribution from production-related indicators to the CFNAI decreased to –0.45 in January from +0.08 in December. Industrial production fell by 0.6 percent in January after edging up 0.1 percent in December. The sales, orders, and inventories category made a contribution of +0.02 to the CFNAI in January, up slightly from a neutral contribution in December. The Institute for Supply Management’s Manufacturing New Orders Index increased to 58.2 in January from 51.3 in December.
This simply confirms recent weakness from the industrial sector, which is one of five key coincidental indicators. The sharp decline in industrial production is a prime reason why my recession probability in the next 6-12 months remains at 25%.
The overall tenor of today's news was weak. Building permits continue to decline and Fed Chair Powell's testimony was less than inspiring. The longer end of the Treasury market had the biggest gains (up about .5%) while the mid and small cap equity markets were off slightly under 1%. The larger cap averages were near unchanged.
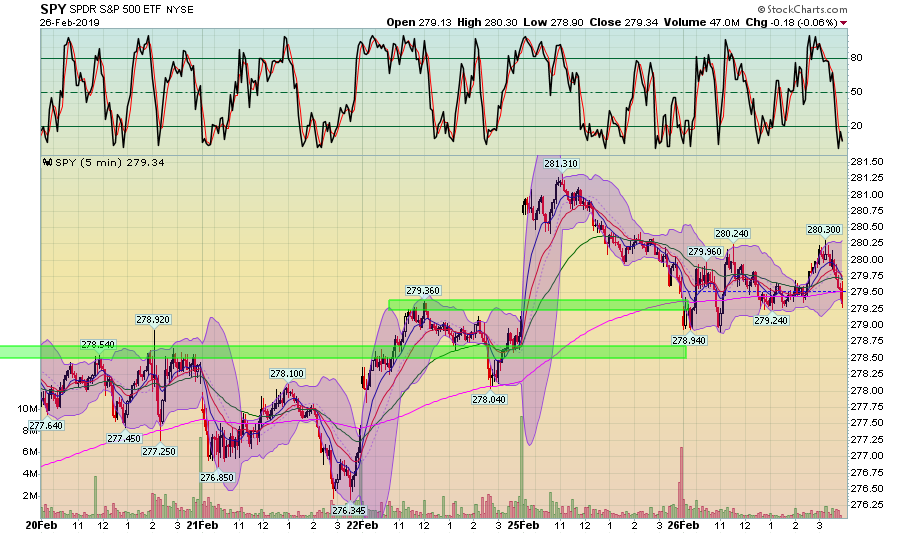
The market's overall tenor has been sluggish. Let's start with the 5-minute SPY chart:
Prices gapped lower at the open and then traded around yesterday's close until about 2 PM. Prices tried to rally as we went into the close, but they couldn't keep the upward momentum. Prices fell sharply near the end. Right now, the 279 level is very important; it's providing a great deal of technical support.
Other charts add to the sense of overall malaise.
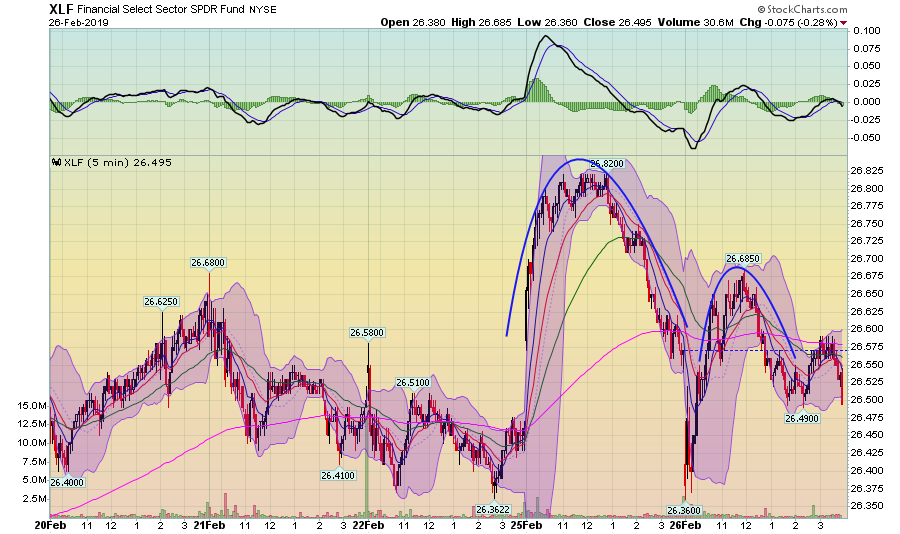
Over the last two trading sessions, the XLF has made several pronounced round-trips. This is the SPY's third-largest component.
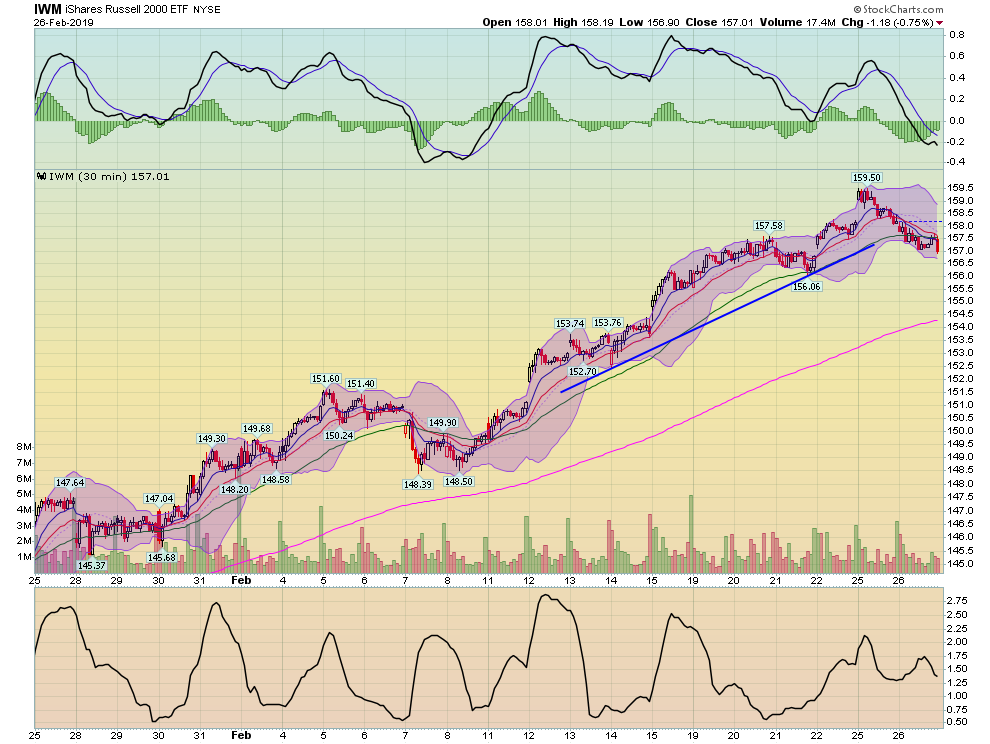
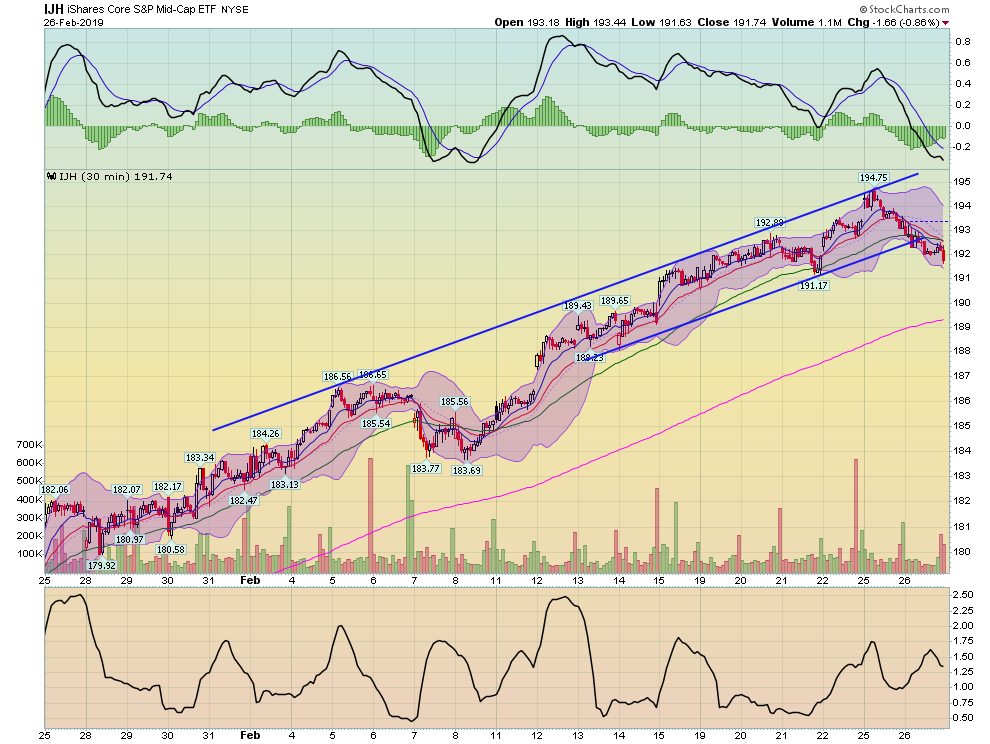
We're also starting to see some trend breaks in the longer-term charts:
The IWM has broken the short-term trend line that's lasted for eight days.
The mid-cap index also broke a trend-line today.
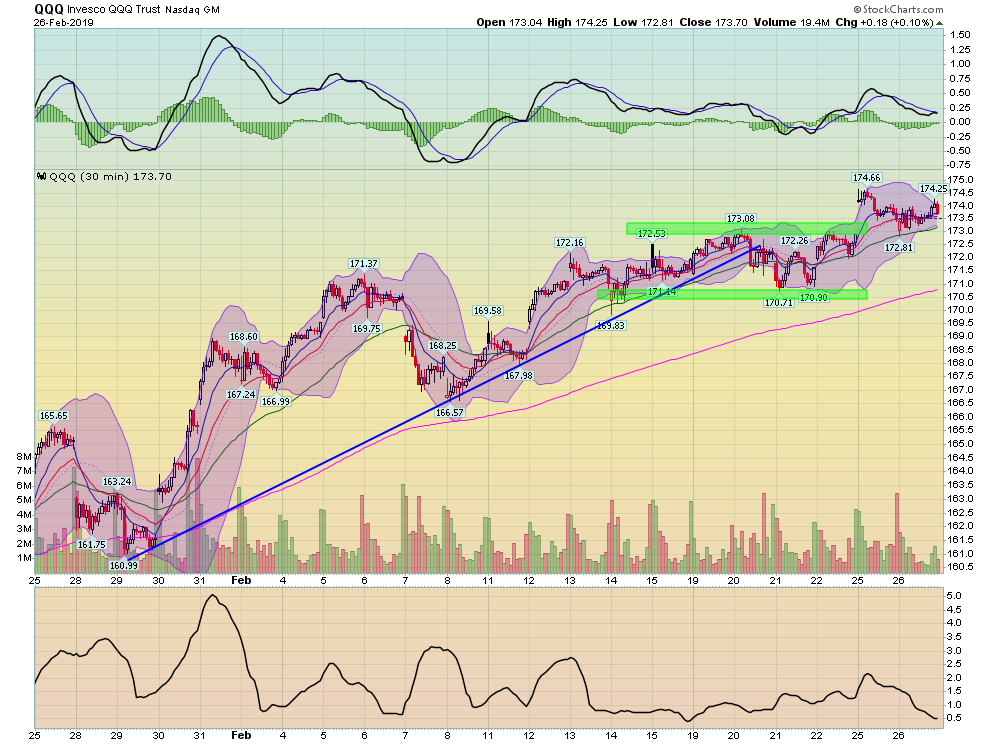
The Nasdaq is having a hard time making any upward progress. It traded in a three-point range for most of last week. Prices broke out on Monday, but have had a difficult time maintaining further upward progress.
And then we have a few key trend breaks in the longer ETF charts: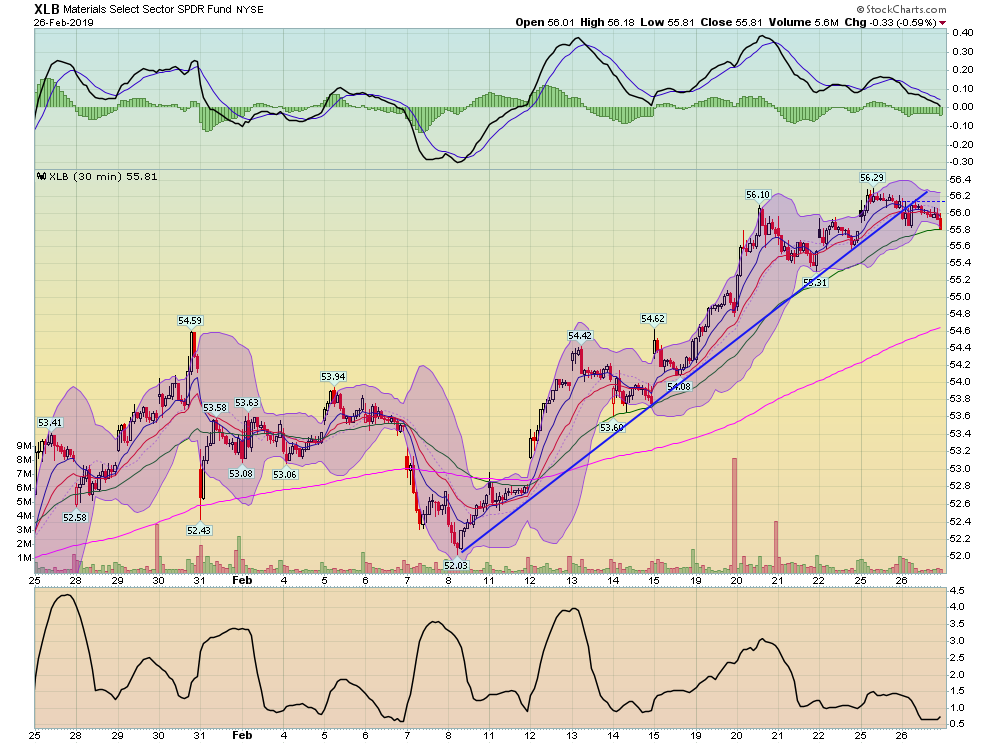
The XLBs -- which have done very well as a result of M&A activity along with bullish trade talk -- broke technical support today, as did ... 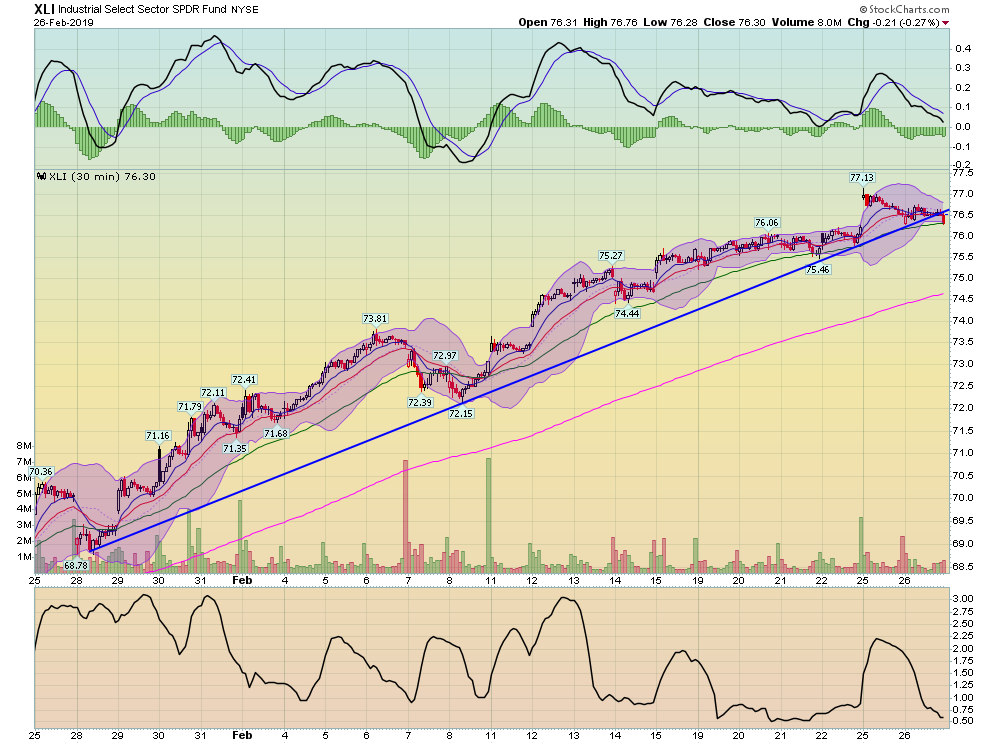
... the Industrials (which broke a nearly month-long trend) ... and ... 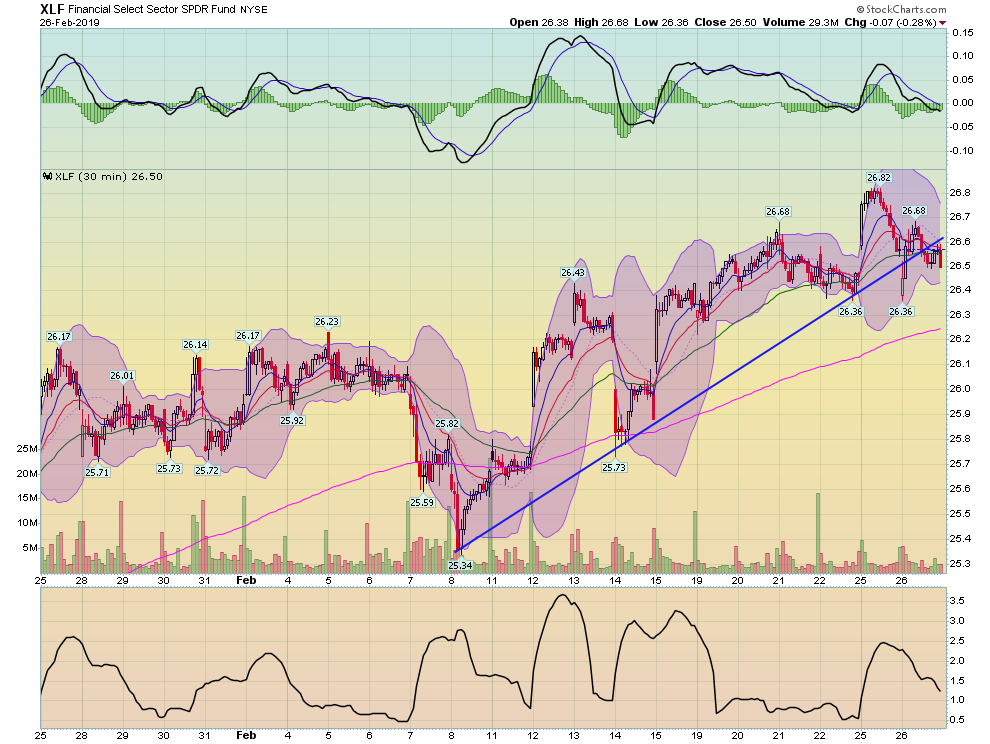
... the financials.
The first two days of this week's trading have been sluggish at best. With the markets having made new highs for the last nine weeks, it's starting to feel like we're moving into a correction.
Disclosure: I/we have no positions in any stocks mentioned, and no plans to initiate any positions within the next 72 hours. I wrote this article myself, and it expresses my own opinions. I am not receiving compensation for it (other than from Seeking Alpha). I have no business relationship with any company whose stock is mentioned in this article.

