Summary Technically Speaking For February 25- Brexit is still on the horizon.
- We're seeing increasing signs of problems in China with a government seeking to control too much of the country.
- Today, the markets gapped higher at the open but then sold off for the rest of the session. We could be seeing the beginning of some weakness in the markets.
Brexit still looms large on the economic horizon. Observers continue to believe that Prime Minister May is simply stalling for time to force Parliament to vote for the deal she negotiated with the EU. She just pushed the vote on it to May 12, 17 days from the date with a hard-Brexit would occur. In other Brexit news, Jeremy Corbyn announced that he will back a second Brexit vote:
Britain’s opposition Labour Party said on Monday that it was prepared to support a second referendum on withdrawal from the European Union, a shift that could have significant ramifications for the fate of Brexit and for the country’s future.
EU president Tusk publicly suggested that May request an extension to prevent a hard-Brexit. March 29 continues to be a date fraught with potential economic disaster.
The Chinese economy is slowing. GDP growth is moderating, imports from Asia are down, retail sales are slowing, and industrial production is weaker. Against this backdrop, Prime Minister Xi is growing more concerned about the possibility of civil unrest (emphasis added):
China’s leader, Xi Jinping, abruptly summoned hundreds of officials to Beijing recently, forcing some to reschedule long-planned local assemblies. The meeting seemed orchestrated to convey anxious urgency. The Communist Party, Mr. Xi told the officials, faces major risks on all fronts and must batten down the hatches.
...
“Globally, sources of turmoil and points of risk are multiplying,” he told the gathering in January at the Central Party School. At home, he added, “the party is at risk from indolence, incompetence and of becoming divorced from the public.”
The government isn't the only one concerned about the future; so are Chinese entrepreneurs:
China’s economy is slowing, and the trade war with the United Stateshas pinched growth. But many entrepreneurs are more broadly worried that China won’t pursue the economic and political liberalization it needs. On the contrary, since Xi Jinping took control of the Communist Party in 2012, the party has increased its dominance in every aspect of Chinese society.
Few are predicting a crash, but worries over China’s long-term prospects are growing. Pessimism is so high, in fact, that some businesspeople are comparing China’s potential future to another country where the government seized control of the economy and didn’t ease up: Venezuela.
A strong central government that could react quickly to an economic slowdown by raising government spending or increasing banking liquidity has been a key reason why the country has been able to grow quickly. But as middle classes grow they also expect increased political participation, which is not happening. And that could eventually lead to a complicated internal political environment.
The markets were higher thanks to solid buyout news in the basic materials sector and continued positive news on the U.S.-China trade front. Micro-caps led, gaining .4. The Nasdaq was the second-best performer, rising .34. The SPY was up modestly. The Treasury market sold-off slightly.
But the charts are less than encouraging. Let's start with the 5-day SPY chart:
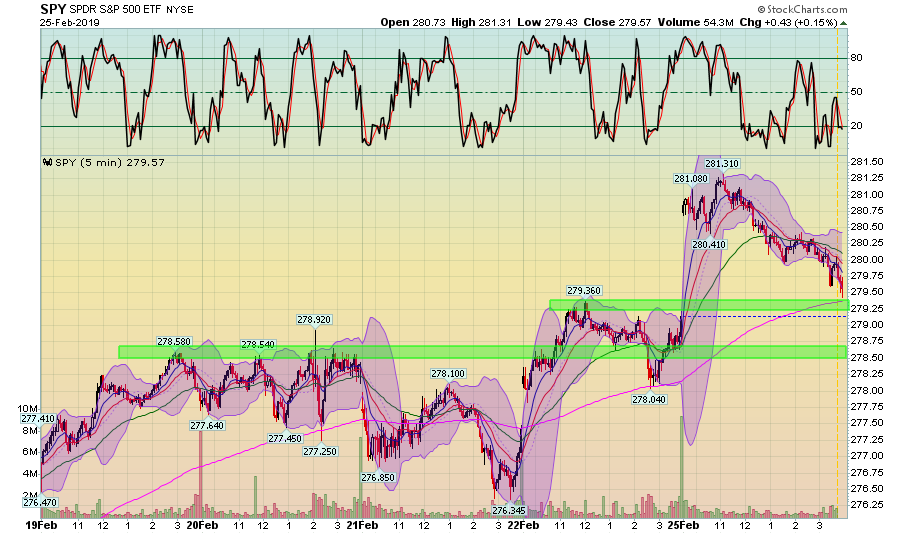
Prices gapped higher at the open. But right after 11 AM, the SPY started a remainder-of-the-day selloff that took the index to the 200-day EMA. Day-long selloffs - especially at the beginning of a trading day - are not encouraging.
Several sector charts show the depth of today's selloff:
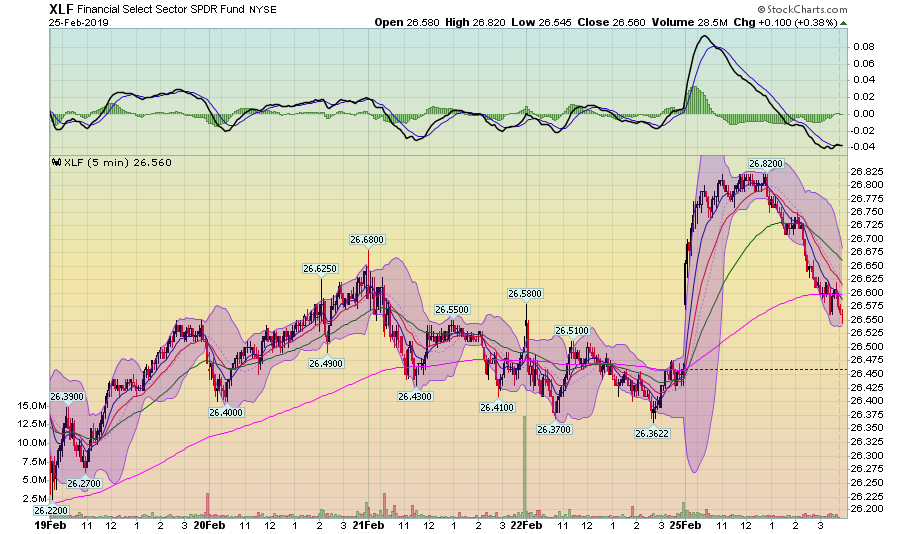
The XLF round-trip was pronounced; the ETF had a strong rally but just as strong selloff, taking prices below the 200-day EMA.
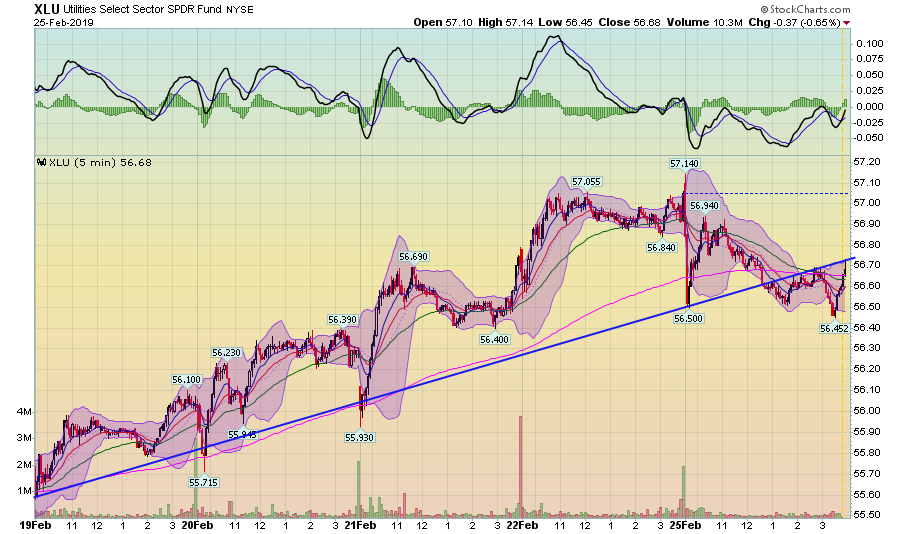
The utility sector broke a short, 5-day trend line ...
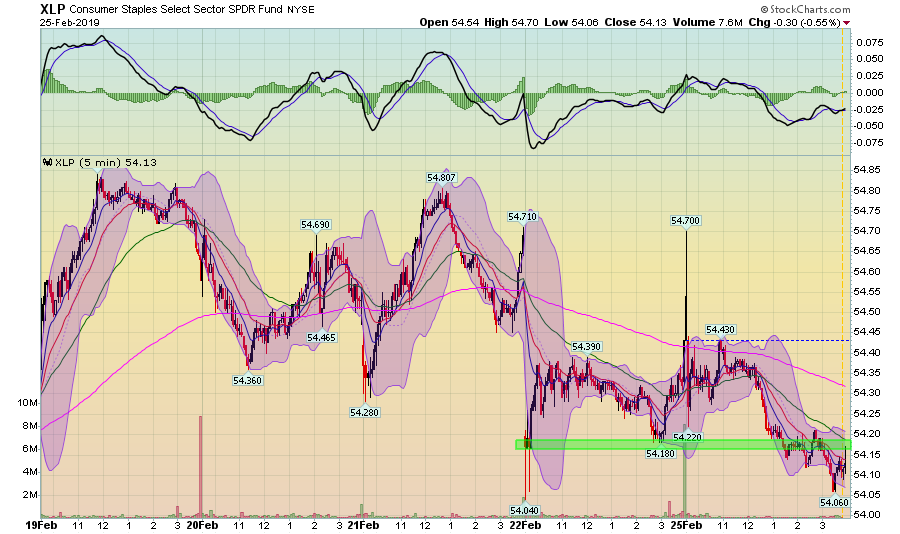
... while the consumer staple ETF is near a 5-day low.
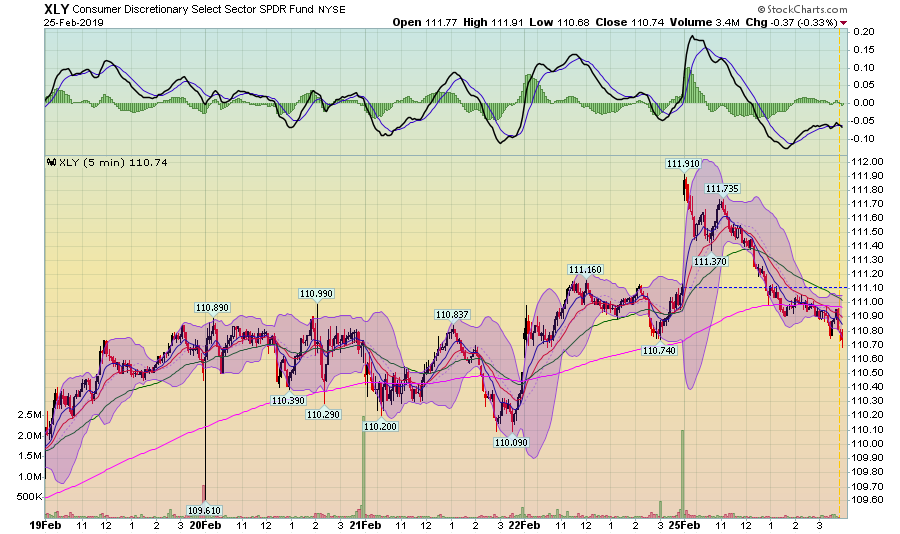
The XLY had the most pronounced selloff of the major sector ETFs
There is also reason to be concerned with the 30-day charts.
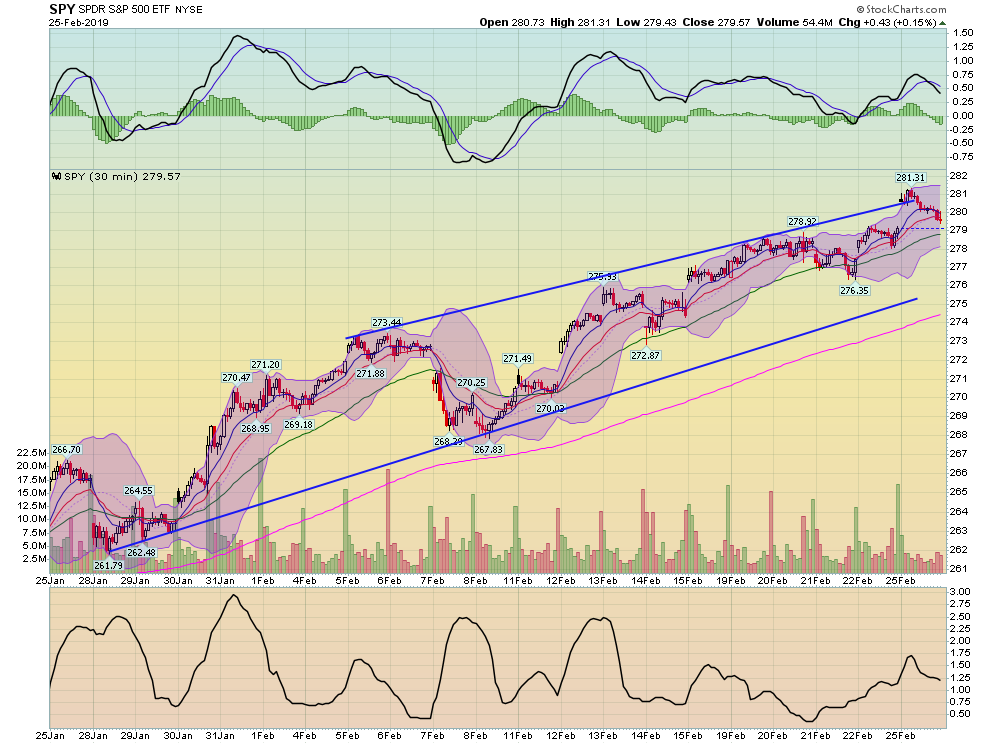
The SPY is fine; it sits at the top of its trading range - despite today's selloff.
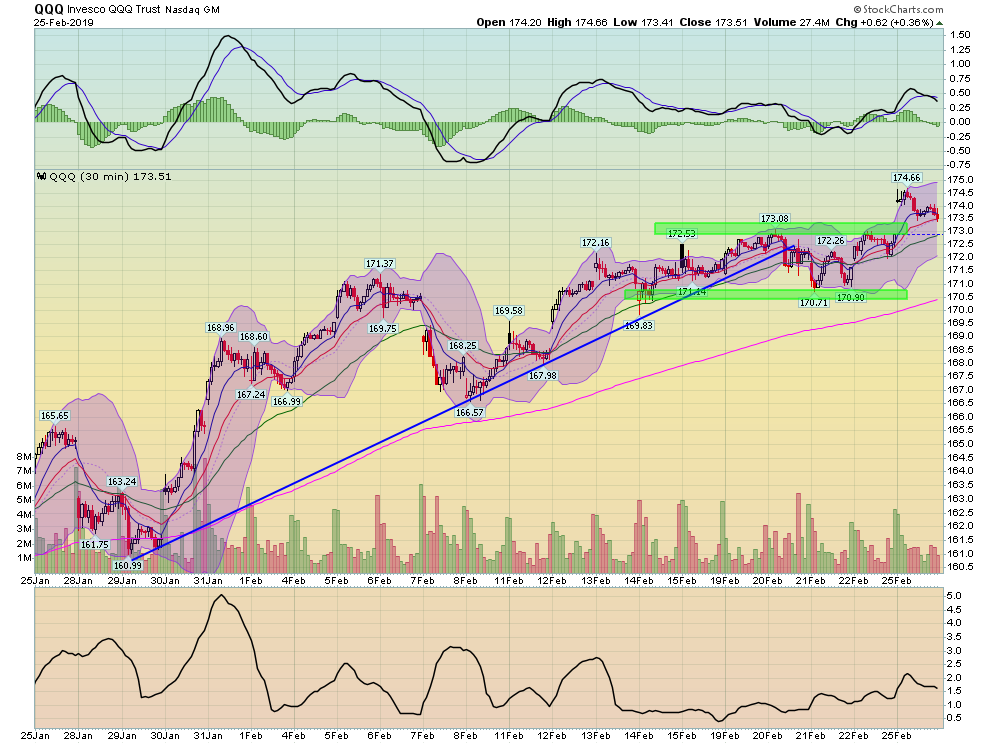
But while the QQQ gapped higher at the open, it continues to have difficulty making gains. Today, prices were once again attracted to the lower 170s.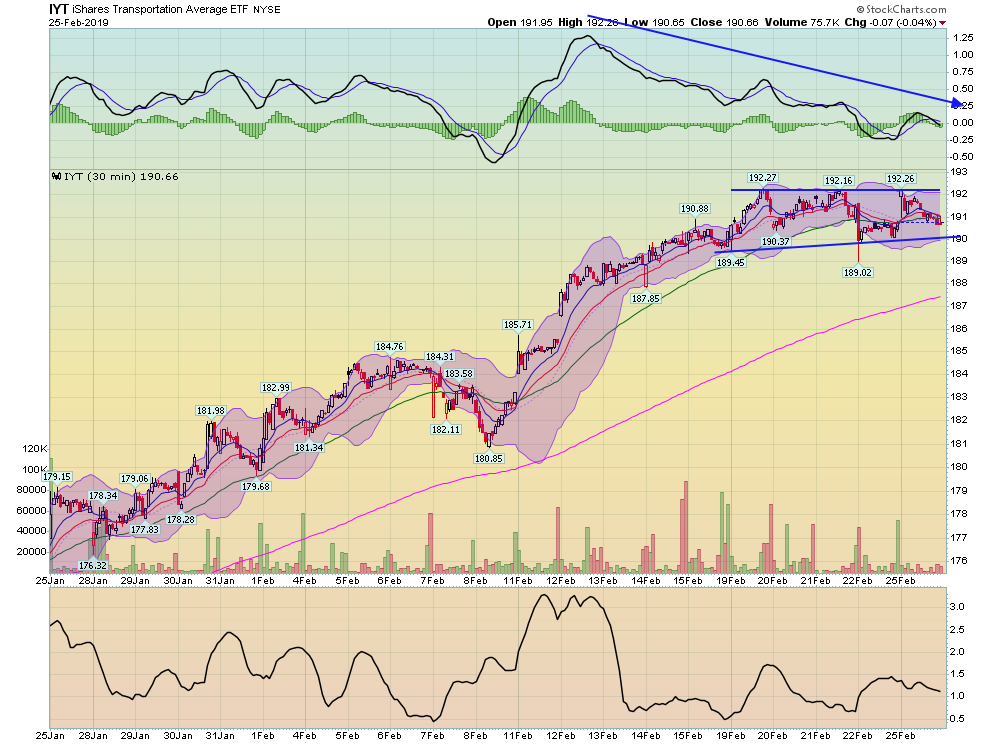
And the transports are consolidating on declining momentum.
The markets have been higher for the last nine weeks. Today's action feels like the markets want to take some profits.
Disclosure: I/we have no positions in any stocks mentioned, and no plans to initiate any positions within the next 72 hours. I wrote this article myself, and it expresses my own opinions. I am not receiving compensation for it (other than from Seeking Alpha). I have no business relationship with any company whose stock is mentioned in this article.
