Investing.com’s stocks of the week
Summary
- U.K. output was weaker in the Q4 18 and contracted in December.
- The number and amount of tax refunds have declined.
- While the IWMs rose today, the SPYs were unchanged. It's possible the IWM is leading the market higher.
U.K. GDP contracted in December and was noticeably weaker in the 4Q18 (emphasis added):
UK gross domestic product ((GDP)) is estimated to have slowed to 0.2% in Quarter 4 (Oct to Dec) 2018, slightly below the latest forecasts produced by the Bank of England (PDF, 4.27MB) and the National Institute of Economic and Social Research (PDF, 317.7KB). Following a pickup in activity over the summer months – in part due to warm weather and the World Cup – real GDP growth slowed markedly in the final quarter of 2018, with GDP falling by 0.4% in the month of December. Construction, production and services output fell in the month, the first time that there has been such a broad-based fall in monthly output since September 2012
The report's data is worse. Production declined 1.1% in the Q4 19. All three sub-sectors (mining, manufacturing, and utility production) contracted for the first time since the Great Recession. The output of 10 of 13 manufacturing sectors declined. Service sector growth slowed to .4% thanks to Brexit-related uncertainty. Business investment dropped .5% -- the fourth consecutive quarterly decline.
Japanese companies are seeing weaker earnings. According to the Financial Times, 1,014 companies in the Topix Index saw their earnings drop by 2.6% in Q4 18. The losses were concentrated in companies with exposure to the U.S.-China trade dispute and the Chinese slowdown. The drop in auto-related exports to China was particularly pronounced. The Bank of Japan uses a Flow of Funds economic model; they often talk of a "virtuous cycle" from income to spending.
The number of tax refunds is down 24% and the average refund is 8% lower. Disgruntled taxpayers have taken to social media to complain. This is a very big deal; many consumers count on their tax refund for spending. Keep your eye on future retail sales and sentiment indicators for weakness caused by this development.
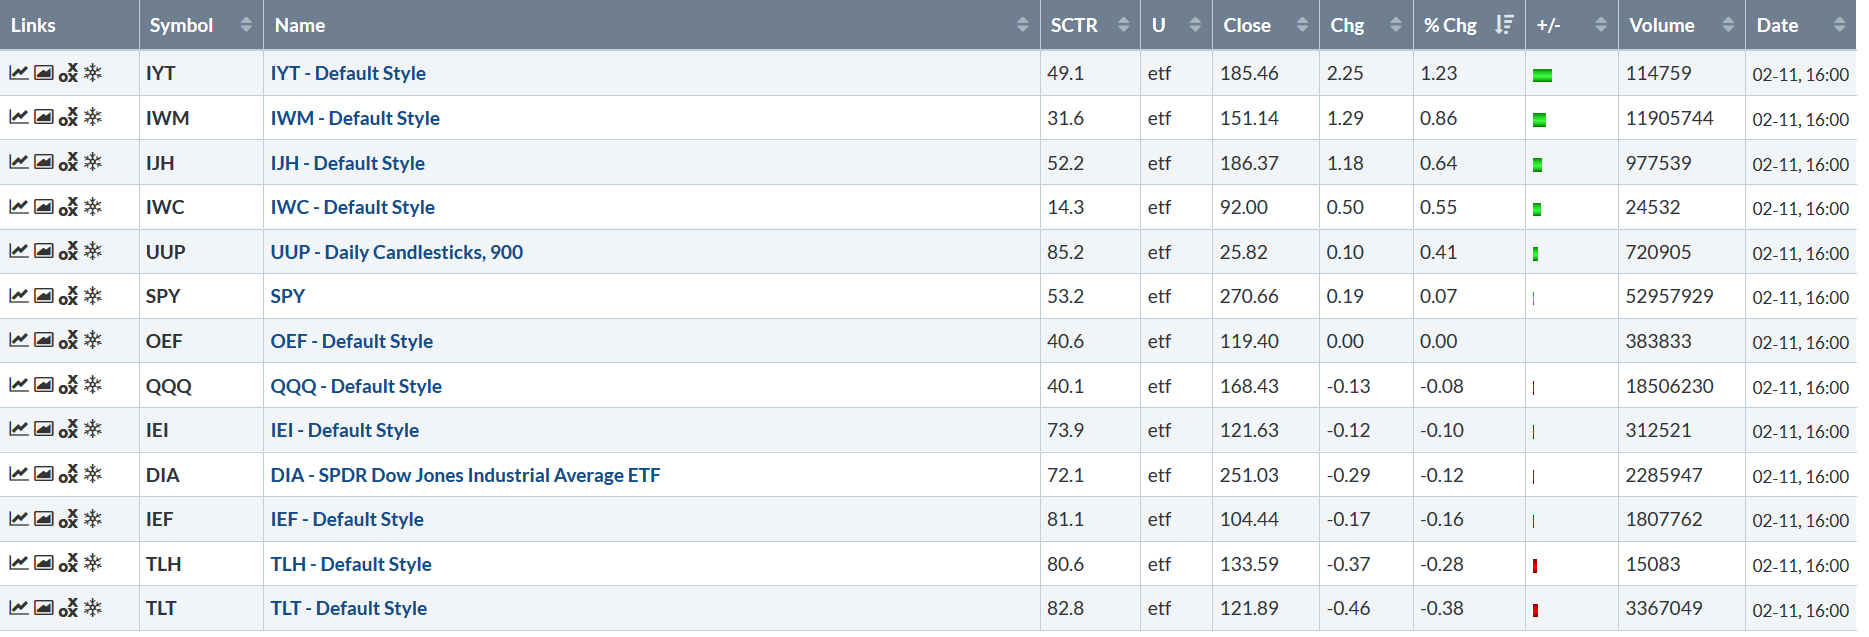
Let's look at today's performance table:
The market was split today, with the Transports and small caps rising strongly and the larger company indexes SPY and QQQ trading right around 0%. This sets up an interesting situation. It's possible the small-cap rally could be leading the market higher.
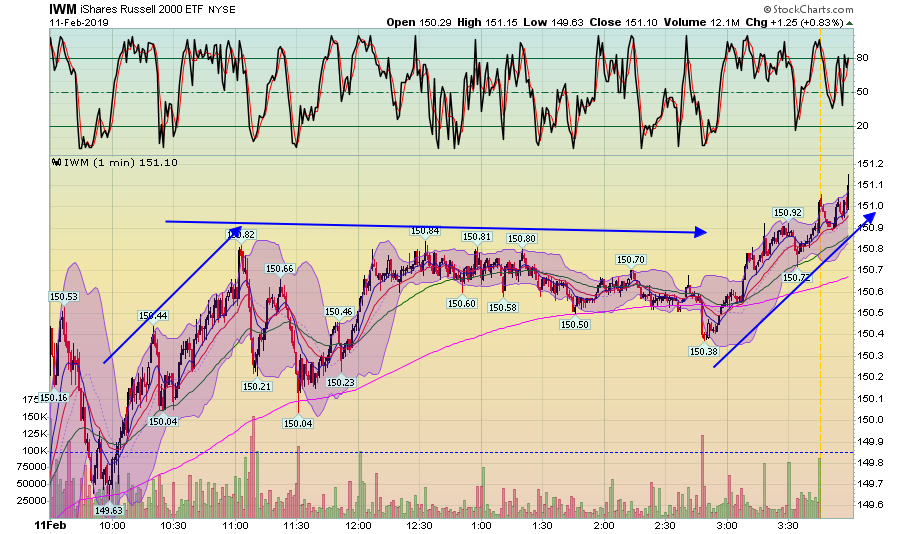
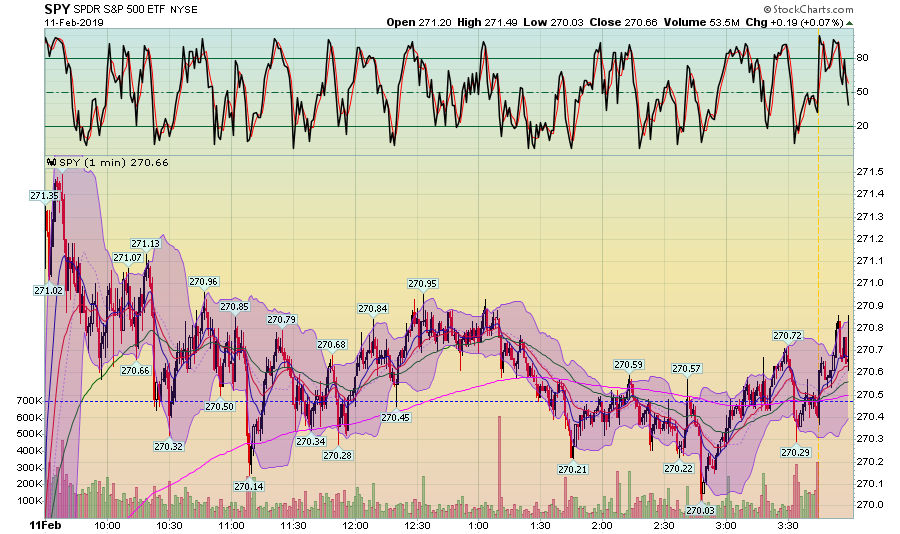
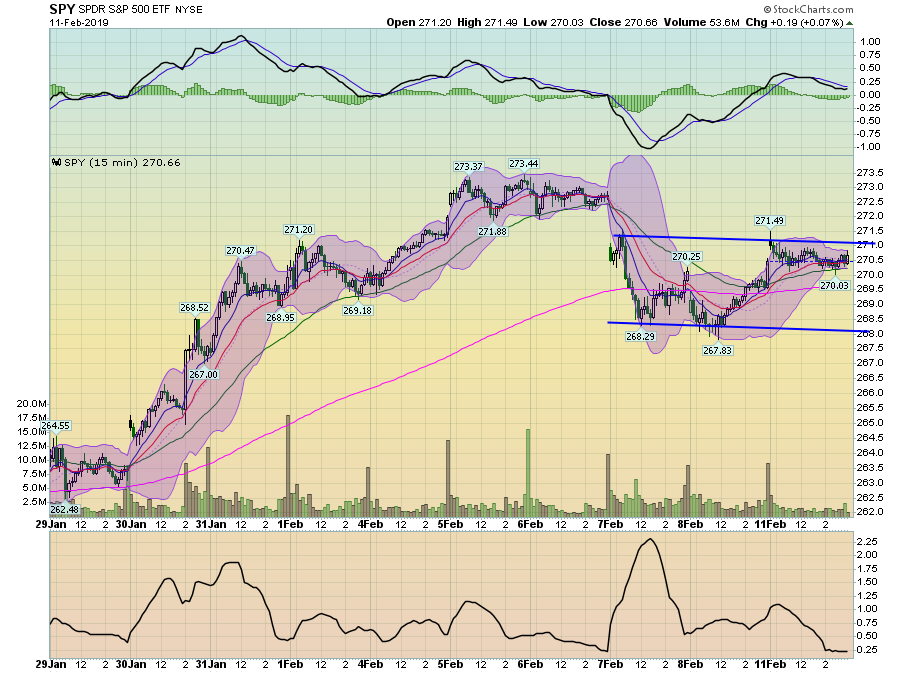
Let's start the analysis by looking at today's charts for the IWM and SPY:
There are three stages of movement for the IWM. The first is a rally that lasted until 11 AM. Prices then traded sideways for most of the day. Right before 3:00 PM, they fell through the 200-minute EMA but then rallied into the close, ending the day at their highest levels.
In comparison, the SPY traded right around Friday's close for the entire trading session.
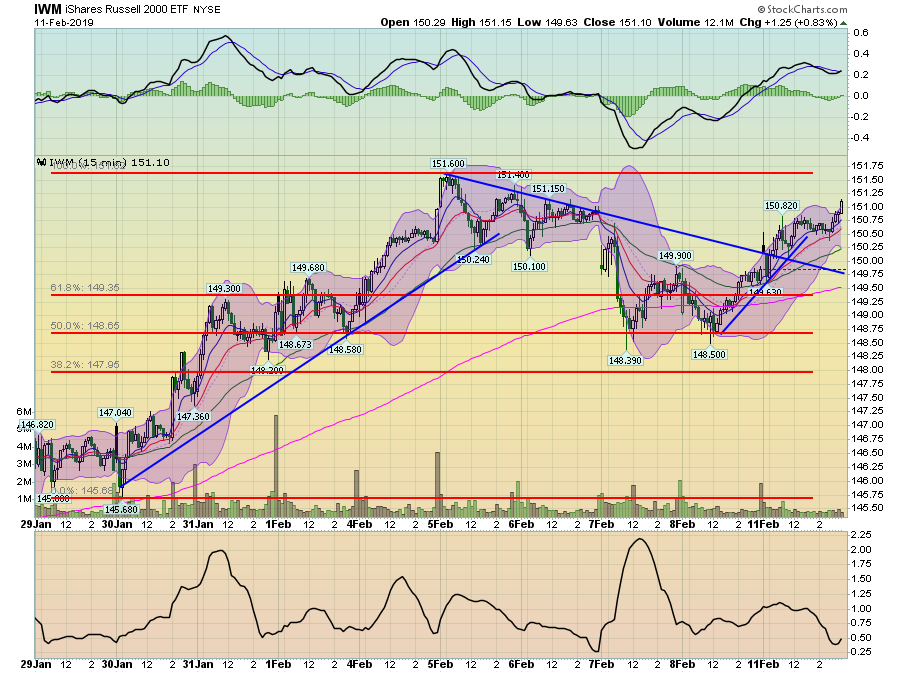
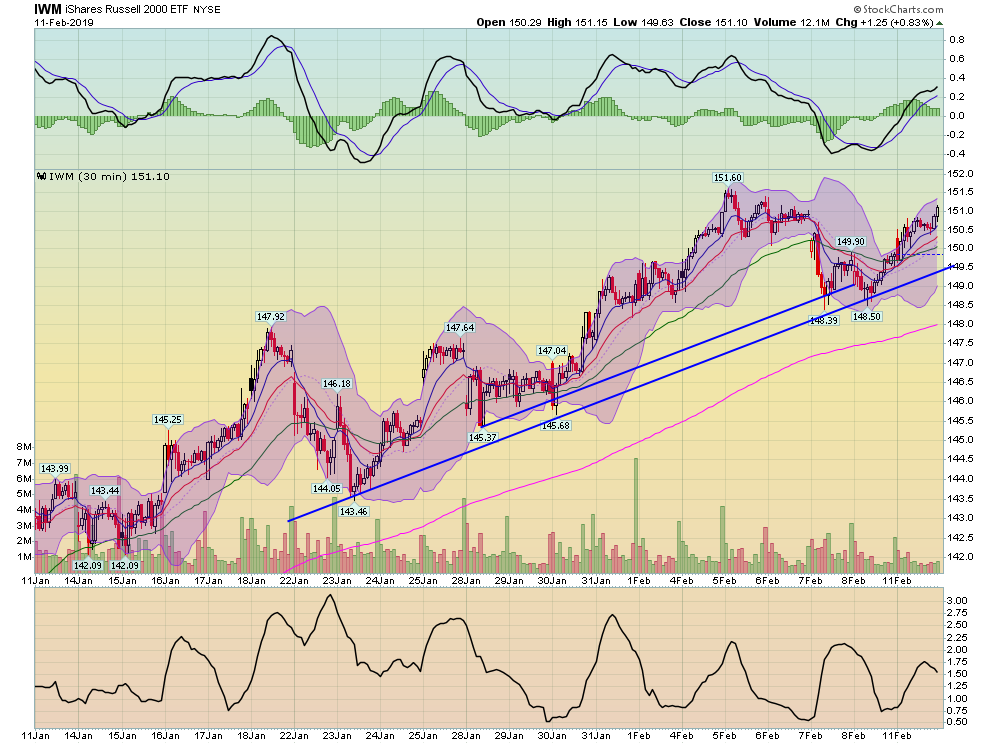
IWM's 2-week chart shows three trends as well. Prices rallied from the end of January to February 5. They then moved lower, hitting the 61.8% Fib level, which also corresponds to the 200-minute EMA, at the end of last week. Today, they rallied and are marginally below their 2-week high.
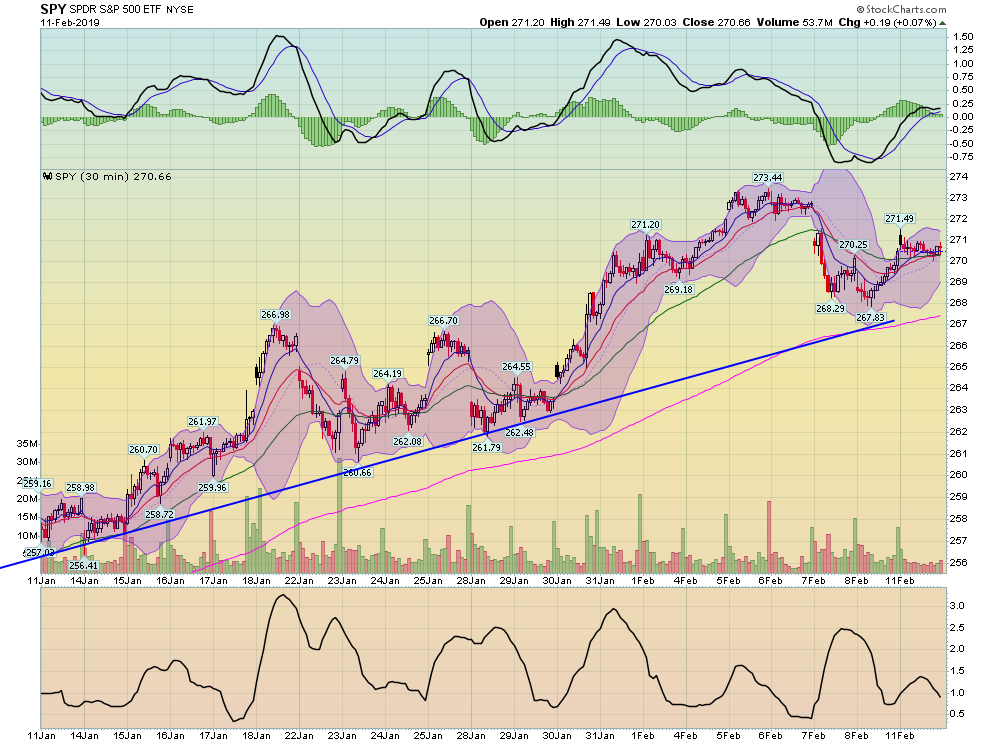
In contrast, the SPY has traded sideways for the last three days, fluctuating around its 200-minute EMA.
On the 30-day chart, both continue to move higher and remain in their uptrends.
Is the IWM leading the market higher? It wouldn't be unheard of. If traders think earnings are moving higher, they'll probably bid small caps higher as this part of the market is more driven by earnings. This is also a good sign overall as the IWM's rally means the market's risk tolerance is up.
Disclosure: I/we have no positions in any stocks mentioned, and no plans to initiate any positions within the next 72 hours. I wrote this article myself, and it expresses my own opinions. I am not receiving compensation for it (other than from Seeking Alpha). I have no business relationship with any company whose stock is mentioned in this article.

