Summary
- Housing continues to soften
- German business confidence is softening; oil remains in a bear market
- There's still a dearth of bullishness on any of the charts
The housing market continues to soften. The latest indication was the sharp decline in homebuilder sentiment.
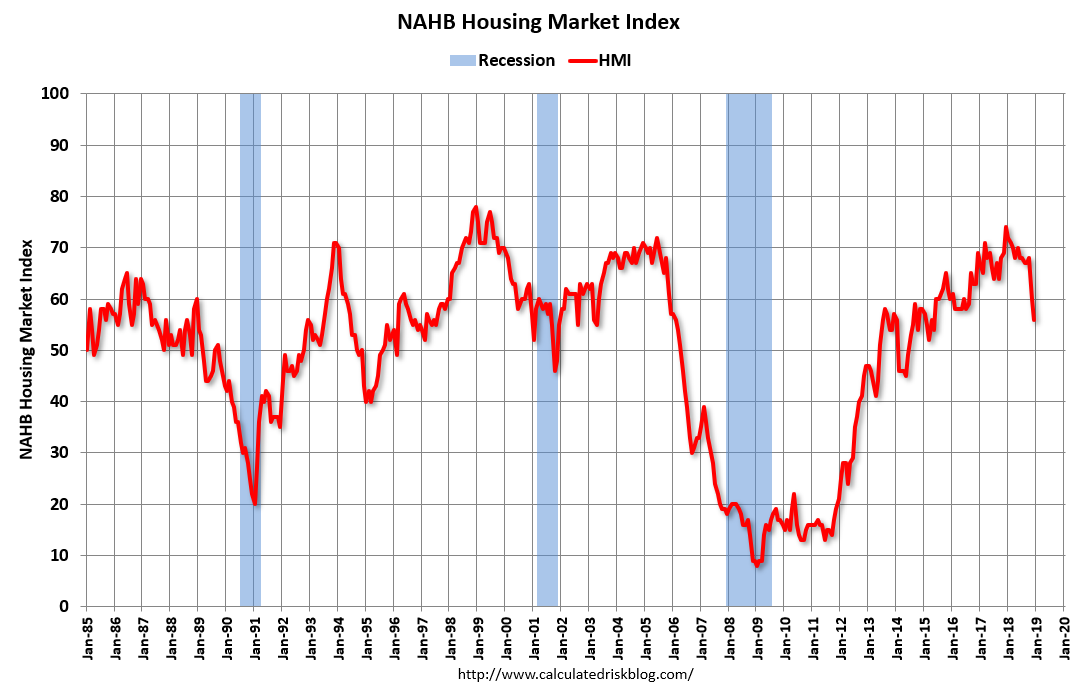
New and existing home sales have been declining since the 4Q16. The pace of price increases are declining; 1-unit building permit activity is softening. Rising interest rates are a contributing factor: 15 and 30-year mortgage rates increased about 150 basis points since the 2H16. Don't discount home affordability. According to Census data, the median price of a new home is $310,000 -- hardly a "starter kit" level. The average price is nearly $400,000. The deterioration in the fundamental picture has sent the homebuilding sector into a bear market:
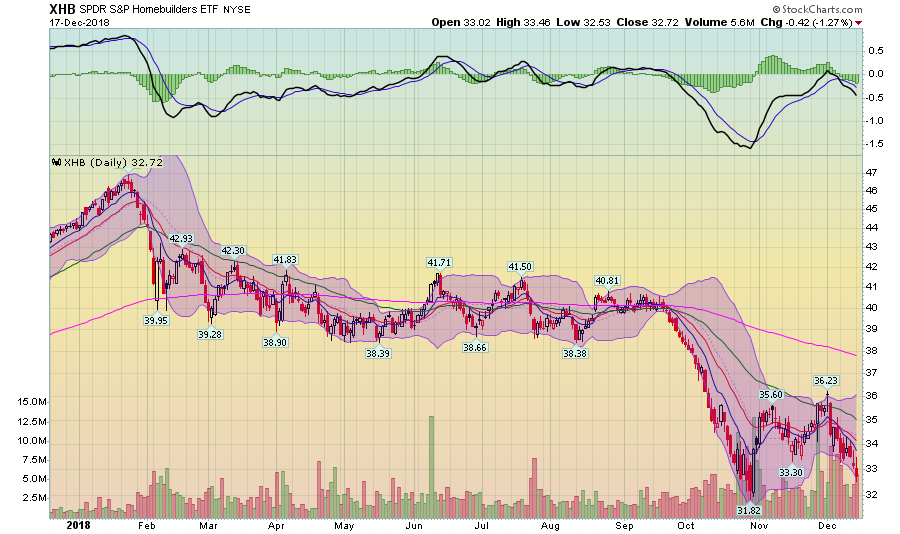
The SPDR S&P 500 Homebuilders ETF (NYSE:XHB) is down about 30% and is currently trading near 52-week lows. The good news is that the homebuilders learned their lesson from the housing bubble; inventory is very contained, meaning this economic sector is weaker but is nowhere near a crash scenario.
German business sentiment continues to decline.
From IFO:
Concern is growing among German businesses. The Ifo Business Climate Index fell to 101.0 points in December from 102.0 points in November. Companies were less satisfied with their current business situation. Their business expectations also continued to deteriorate. The German economy faces a lean festive season.
All three sub-indexes are declining:
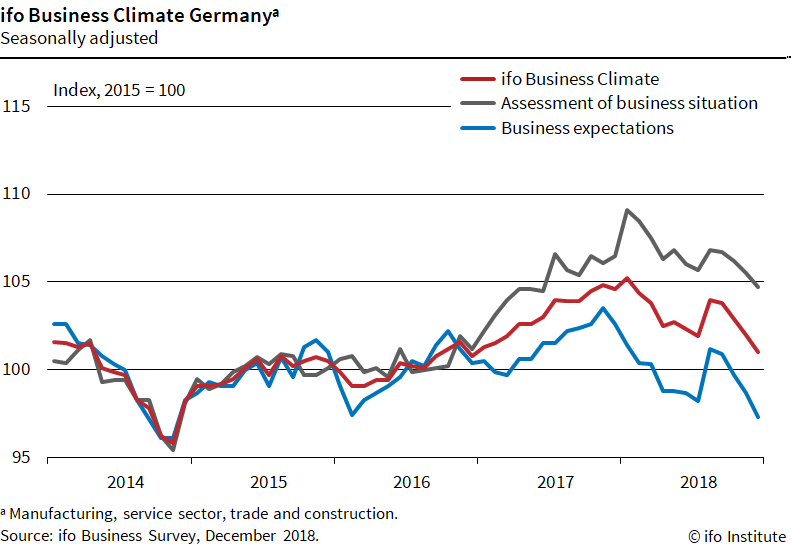
The decline in expectations that can be seen in blue is particularly concerning, as it will negatively impact future business decisions like capital expenditures and employment decisions. Levels are currently approaching 5-year lows.
Oil remains in a bear market:
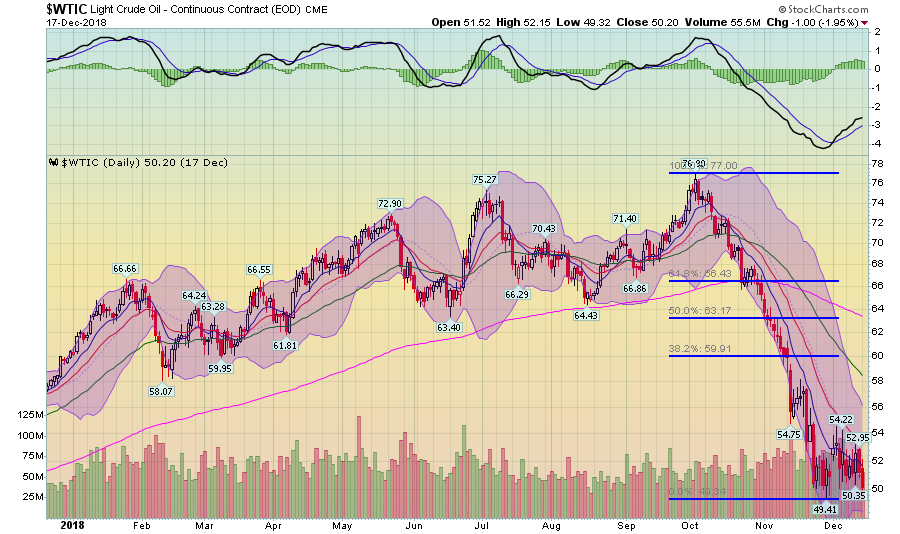
Oil is consolidating at the bottom of a long sell-off. The good news is this means oil prices won't cause a recession -- at least, not now. The bad news is that weaker predicted demand is a reason why oil is down.
Let's turn to today's performance table:
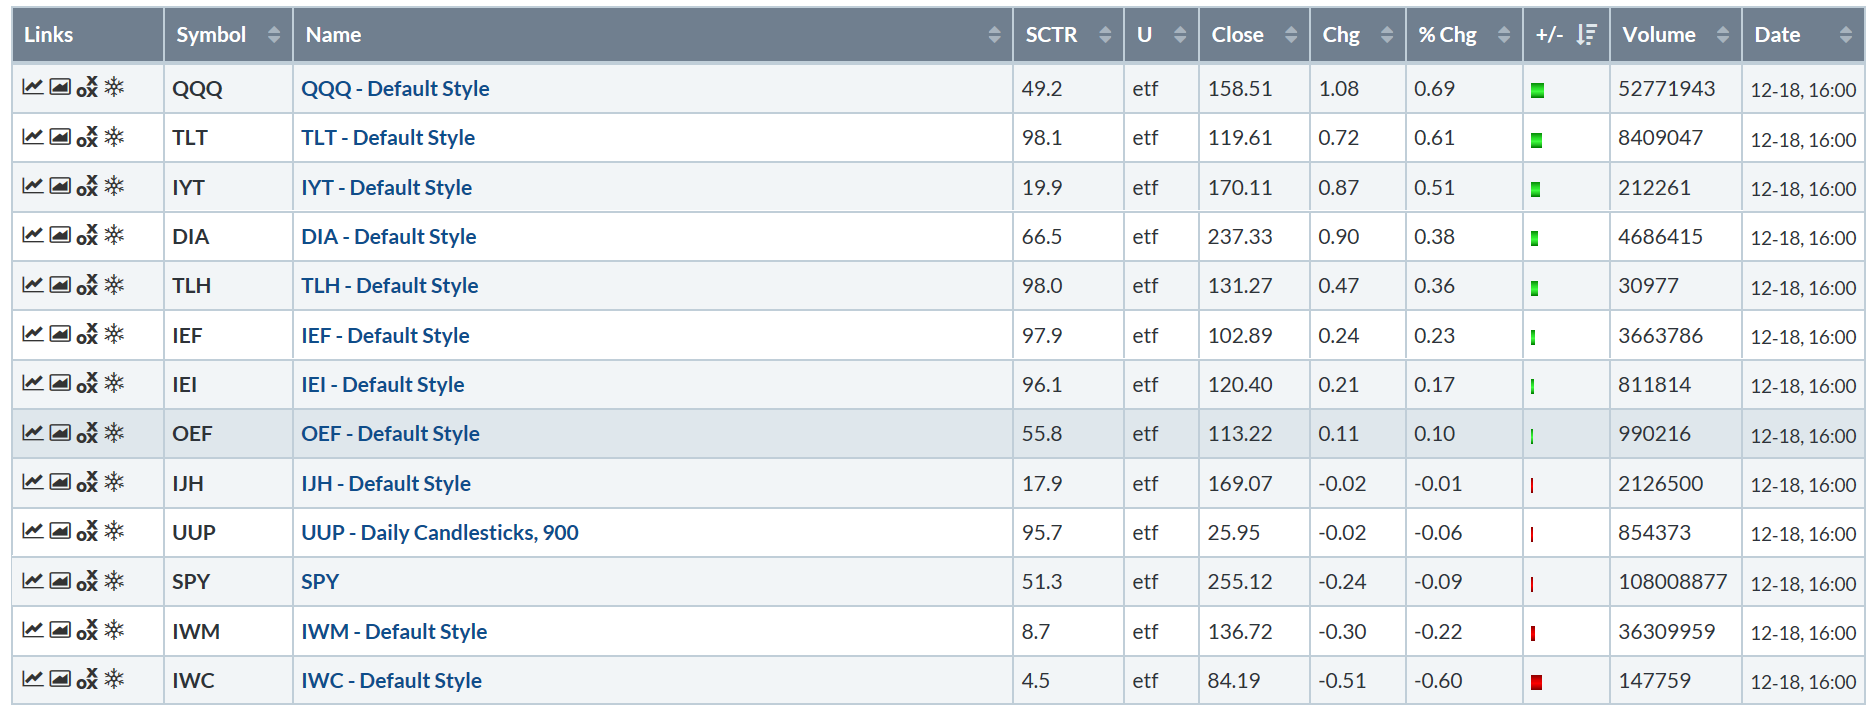
As recent tables go, we'll take it. NASDAQ was the best performer -- but so was the long-end of the Treasury curve. The SPY (NYSE:SPY) was modestly lower which was followed by the smaller-cap indexes, each of which posted a small loss.
Remember, we're looking for any bullish sign in any timeframe and we're not getting it.
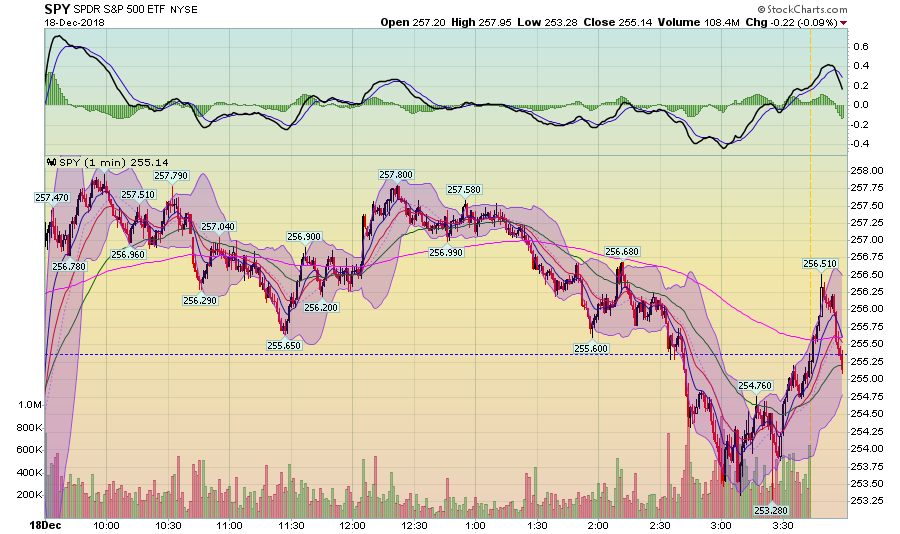
Prices gapped higher at the open -- a promising development. They fell to just above yesterday's close then rallied again. But they couldn't get above the previous high. Prices moved lower, eventually falling through yesterday's close. They tried one last time to rally but just couldn't hold it.
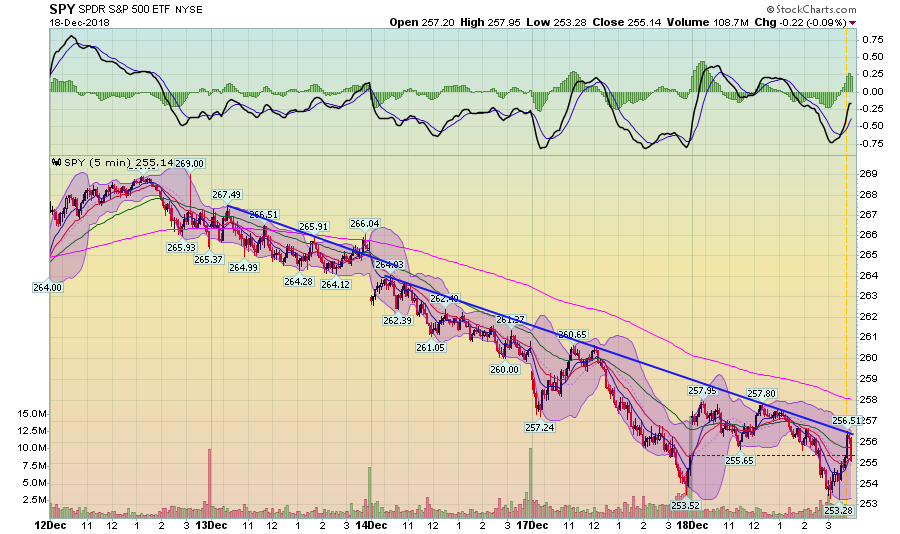
We're now in the fourth day of the decline that started on December 13. Today's price action continued to hit resistance.
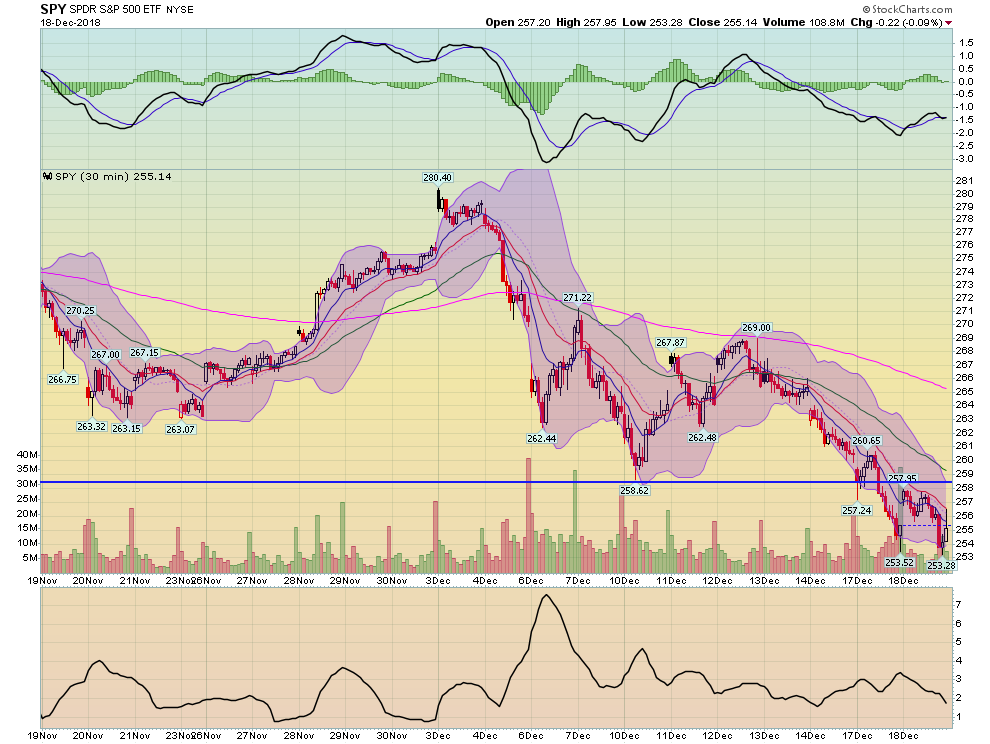
The 30-day chart is near a 30-day low. The only potentially good news is that the chart might be forming a double-bottom. But that's it. The remainder of the chart is bearish: EMAs are moving lower, weak momentum, and a chart printing lower lows and lower highs. And that leads us to the daily chart:
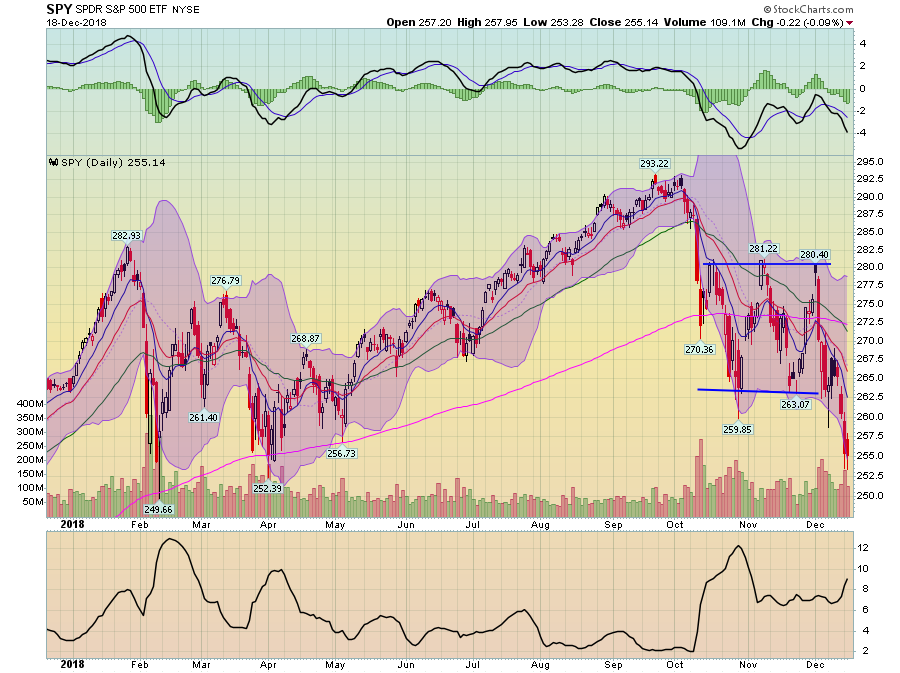
The last three days have seen some fairly long candles and increased volatility. The 50-day EMA has now crossed below the 200-day EMA; momentum is falling. There's just not much good news here.
The next possible rallying point is the Fed's announcement tomorrow. The key will be future rate-hiking language. If we get a dovish tone, I'd expect a rally.
Disclosure: I/we have no positions in any stocks mentioned, and no plans to initiate any positions within the next 72 hours. I wrote this article myself, and it expresses my own opinions. I am not receiving compensation for it (other than from Seeking Alpha). I have no business relationship with any company whose stock is mentioned in this article.
