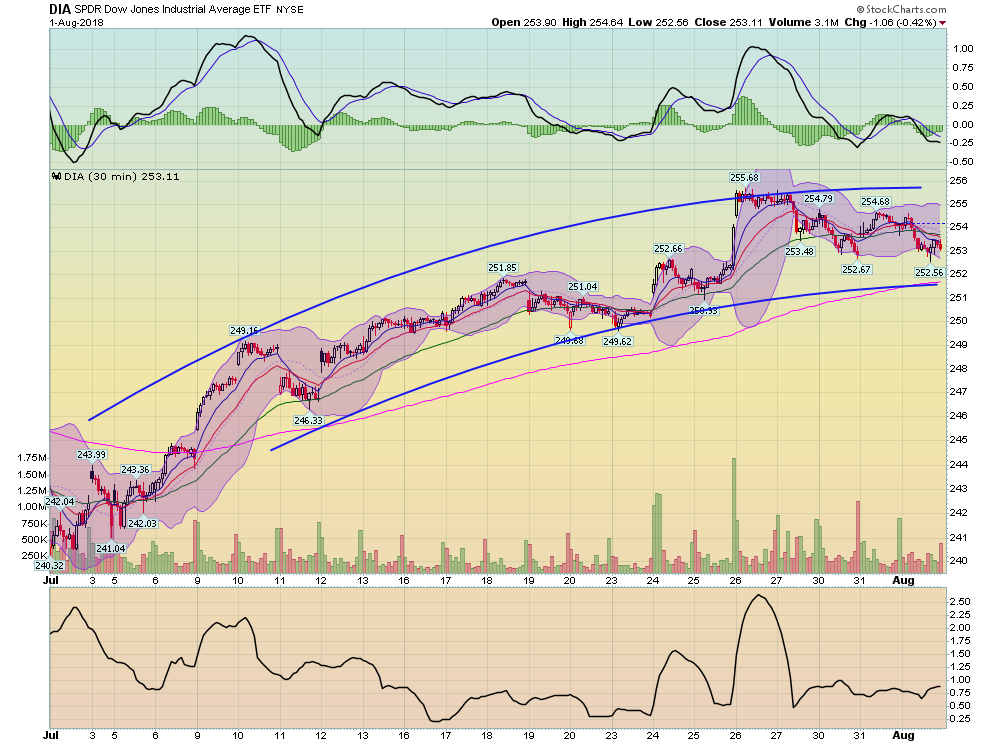
Investing.com’s stocks of the week
Summary
We shouldn't be concerned about the 10-year Treasury moving above 3%.
Will oil see an additional leg higher at the end of the year?
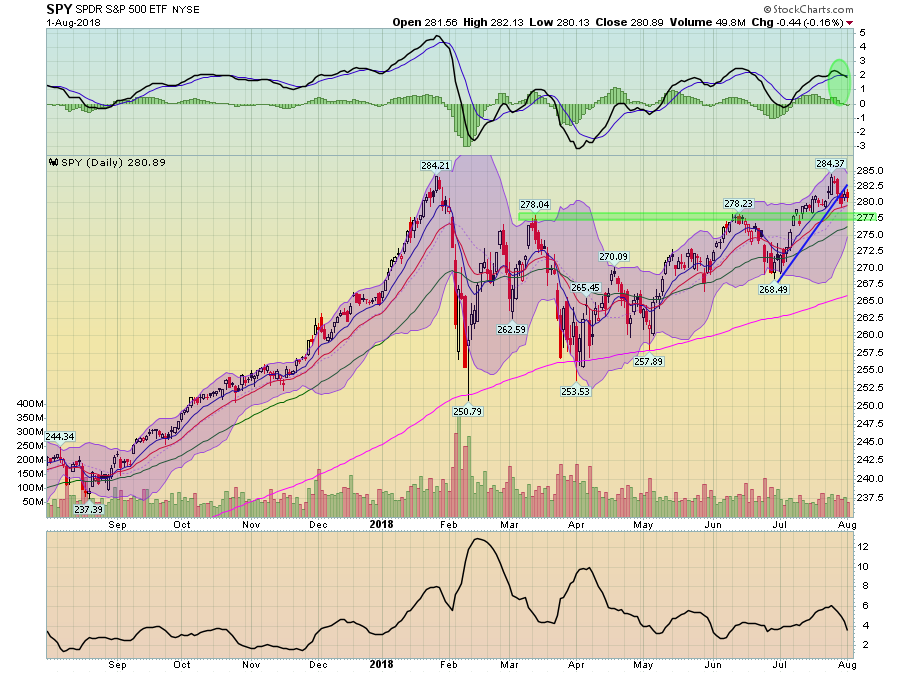
It looks like the SPDR S&P 500's (NYSE:SPY) upward movement is stalling a bit.
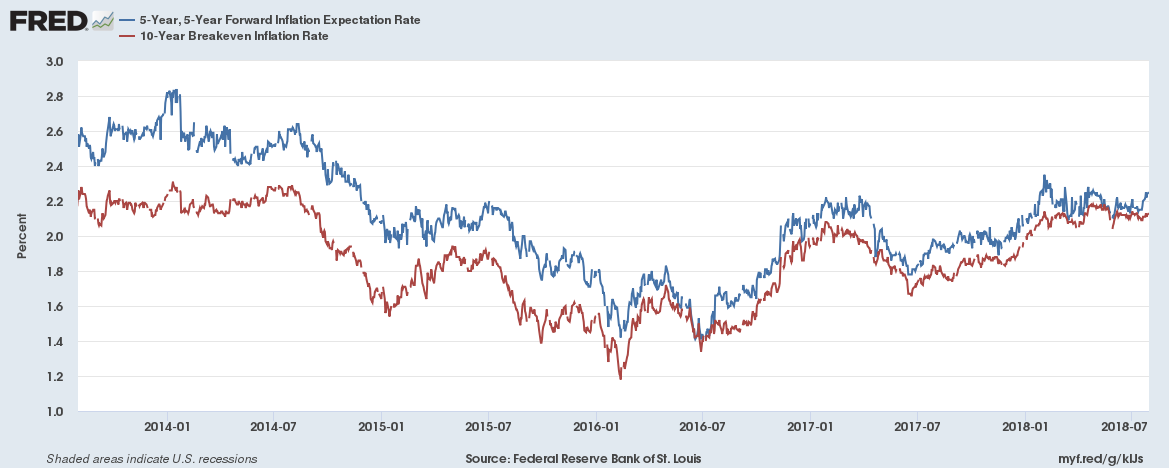
Should we be concerned about the 10-year hitting 3%? The FT reported that the 10-year Treasury crossed the 3% mark "for the first time since June 13." Don't be concerned. It would have been far more noteworthy if it had happened after the BEA reported 4.1% Q/Q growth. Then it would indicate that traders thought faster growth would cause higher inflation. Instead, prices were remarkably tame after that release. There are other reasons to be unconcerned. Forward inflation expectations (which comprise a large percentage of interest rates) are still contained:
Both the 5 and 10-year rates are still at very reasonable levels. And the median real rate of interest (as calculated by the Richmond Fed) is low:
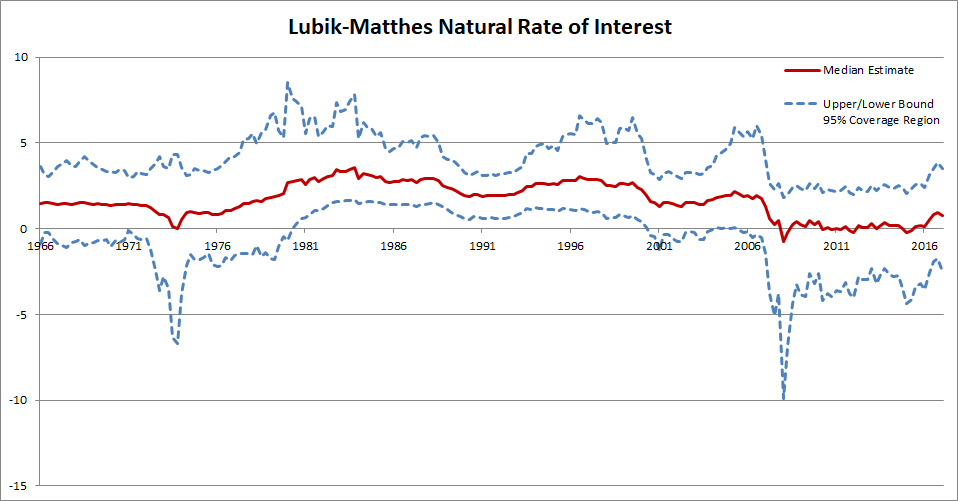
The San Francisco Fed has a similar calculation:
My own view is that r-star today is around 0.5%. Assuming inflation is running at our goal of 2%, that means the typical, or normal short-term interest rate is 2.5%. For comparison, the median longer-run value of the federal funds rate in the Federal Open Market Committee's (FOMC's) most recent economic projections is 2.875% (Board of Governors 2018b). When put into a historical context, r-star stands at an incredibly low level-in fact, a full 2 percentage points below what a normal interest rate looked like just 20 years ago. This trend is not unique to the United States: Averaging across Canada, the euro area, Japan, and the United Kingdom, a measure of global r-star is a bit below 0.5% (Holston, Laubach, and Williams 2017 and Fujiwara et al. 2016).
This increase in the 10-year yield is most likely related to the spike in Japanese yields, which is occurring as the market is testing the BOJ's new yield curve control policy. In other words, it's doubtful we'll see the 10-year move much higher than 3.25%, all things being equal.
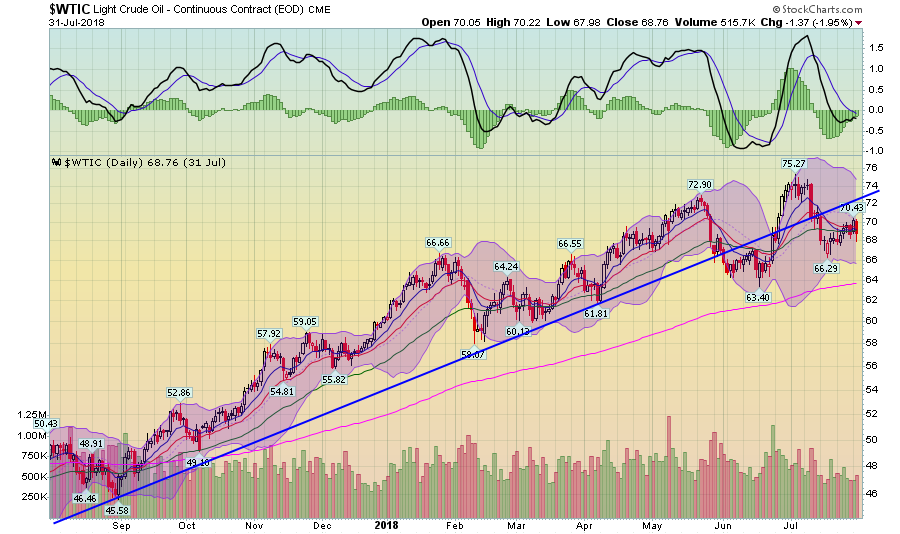
Will we see another leg up in oil prices? After moving higher during the spring, oil prices have now fallen below support:
On an absolute basis, oil prices have risen from a 2018 low of 58.07 to 75.27 - an increase of nearly 30%. Prices have since fallen through the trend line and are finding support in the EMAs. But the MACD is getting ready to give a buy signal. And the full impact of Iran's withdrawal from the oil market won't be felt until the 4th quarter, which could lead to an additional spike in prices at the end of the year.
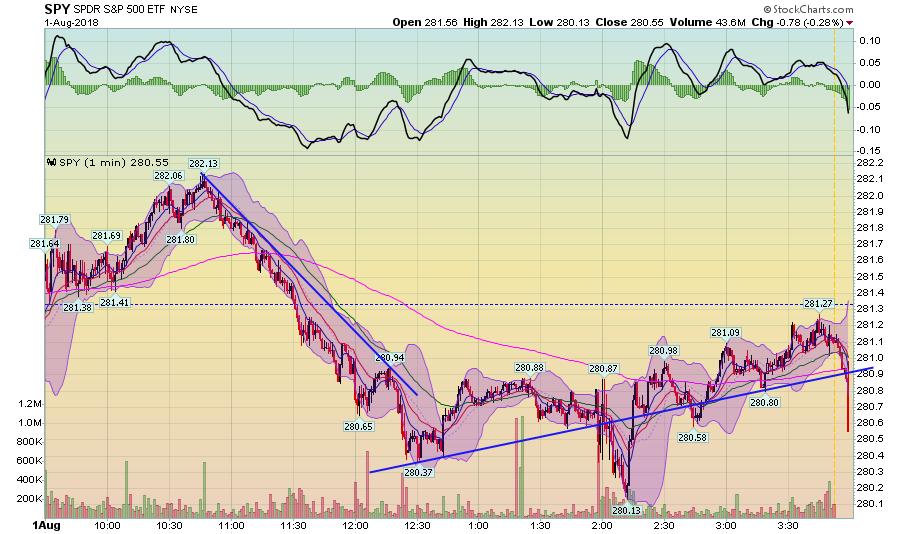
Turning to the markets, the SPYs had two distinct trends today:
We see a clear downtrend from 10:45 to right after lunch, with prices falling a few points to 280. Prices attempted to stage a rebound in the afternoon. But they experienced a sharp sell-off right after 2 PM and then - right at the close - had another really sharp sell-off. The first drop was a clear reaction to the Fed's statement that they'll keep raising rates. End-of-the-day sell-offs are always concerning because they indicate that traders don't want to hold shares overnight, which means they're concerned about bad news occurring in the next 18 hours.
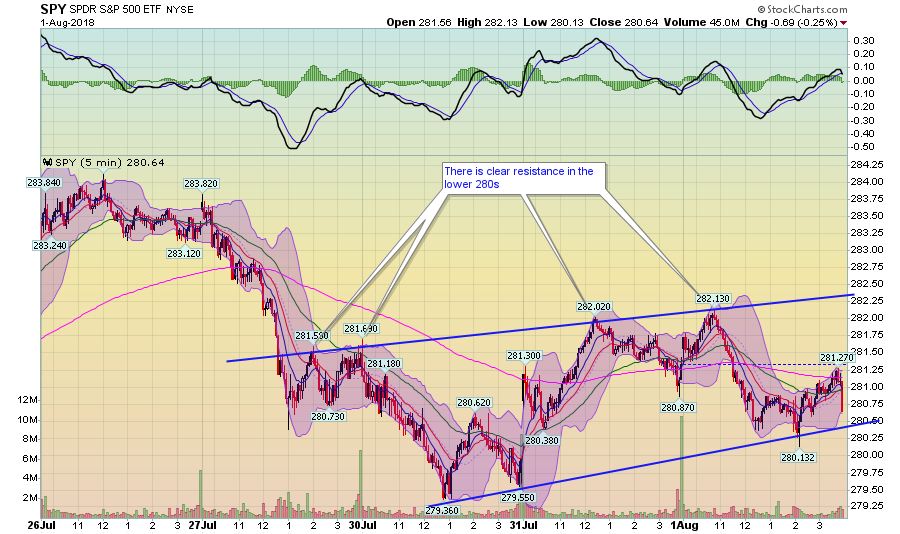
On the 5-minute, 5-day chart we see there is clear resistance in the lower 280s. Prices have tried four times in the last four trading sessions to move through that level, only to be rebuffed.
The 30-day chart shows a clear rounding top formation. Unfortunately, it's near the top, which is not encouraging.
And finally:
The daily chart is looking like its running into trouble. The short-term trend line is broken and momentum is weaker.
Disclosure:I/we have no positions in any stocks mentioned, and no plans to initiate any positions within the next 72 hours.
I wrote this article myself, and it expresses my own opinions. I am not receiving compensation for it (other than from Seeking Alpha). I have no business relationship with any company whose stock is mentioned in this article.

