Technically Speaking For April 10
Summary
- Solid service sector and employment data run counter to the slower economy narrative.
- Gas prices are in an upswing.
- Despite a solid day in the markets, smaller-cap indexes are still below recent highs on their respective daily charts.
Economic data is cutting both ways right now. To some extent, this is a natural function caused by a large amount of financial data available. However, it seems as though the bifurcation between bullish and bearish data has simply become more pronounced over the last 6-9 months. Guy DeBelle of the RBA notes this situation by pointing out the following two data contradictions (emphasis added):
While we don't yet have GDP readings for 2019, the loss of momentum is evident in business surveys of manufacturing conditions in many economies. The slowdown is not as marked in surveys of business conditions in the services sectors. This potentially indicates that the drivers of the slowdown are more external rather than internal. Services say more about domestic demand, which has been more resilient.[1] It is worth remembering that we have both more and more frequent economic indicators of manufacturing than we do of the services sector. The higher frequency data on the manufacturing sector often drives the news cycle. Yet in many economies, including Australia, the services sector accounts for well over half of the economy.
This is a very important point that has been evident in Markit's global sentiment indicators over the last 6-9 months. It's been somewhat less prevalent in the US, where the ISM manufacturing number has declined from the upper 50s/lower 60s to the mid-50s. The central question to ask, assuming this observation is correct, is whether or not the manufacturing slowdown can be contained or whether it's negative ramifications spread to other economic sectors. The answer so far is that the damage is contained.
Debelle's also observed (emphasis added):
At the same time as GDP growth has slowed, the labour market in a number of economies has remained strong (Graph 1). This is particularly true in Germany, Canada and the United Kingdom. In each of these economies, GDP barely grew in the fourth quarter of 2018, but all recorded solid employment growth, above average in some cases. In the United States, GDP growth was around 2 per cent (annualised) in the final quarter, employment growth was almost as strong.
DeBelle continues by observing that unemployment is a lagging indicator, so it might simply be waiting to drop. But U.S. leading labor market indicators have improved over the last 6-8 weeks and the latest employment report returned the 3, 6, and 12-month moving averages of monthly jobs growth to near the 200,000 level (see my commentary from yesterday's post about the household survey, which typically provides a more accurate read of the economy towards the end of an expansion).
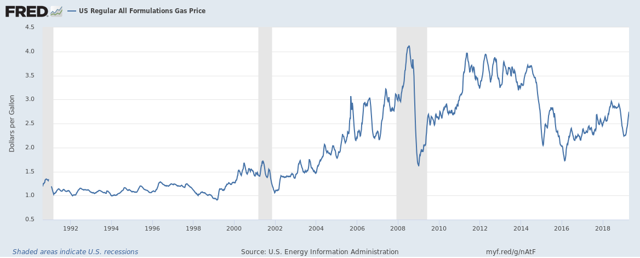
US Gas prices have reversed and are increasing at a fairly steep rate:
Prices are just shy of $2.75 and have increased from $2.25 in February. Gas prices are funny - they don't seem to matter to the public until suddenly they do, usually when they hit a round number like $3.00/gallon. We're still a bit from that key level. But the speed of the recent increase tells us that the market is very fast in adjusting to the increase in oil prices, which have every indication of moving higher.
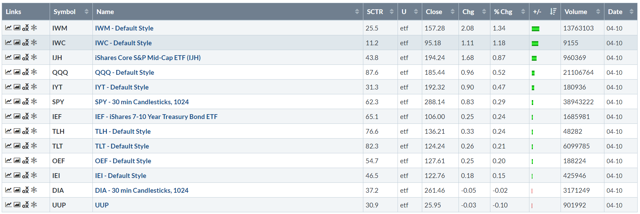
Let's turn to today's performance table:
This table is very bullish: the smaller-cap indexes are at the top of the table while the larger-cap indexes also gained. Also, note that the Treasury market also rallied a bit in reaction to the Fed minutes.
While today's news was good, the price action did not overcome all the technical losses from yesterday's selloff. Let's start with the 30-minute charts: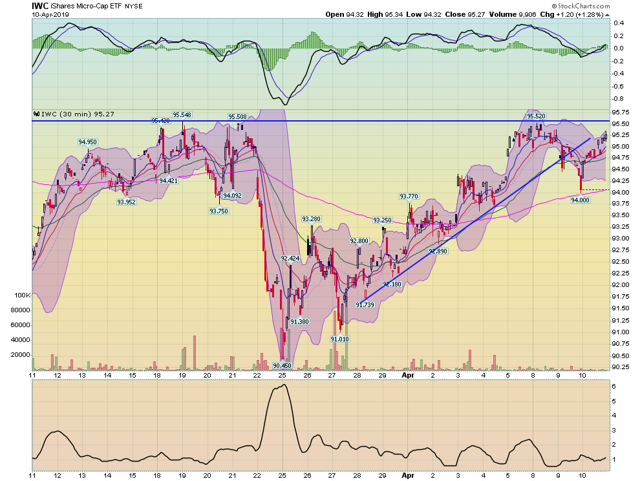
The IWC's trend break is very clear in the above chart. Prices rallied strongly today but are still below the high established in mid-March. On the plus side, the MACD has plenty of room to run higher.
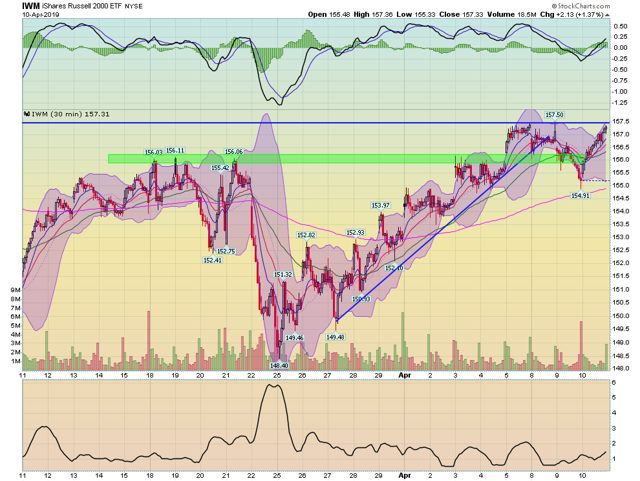
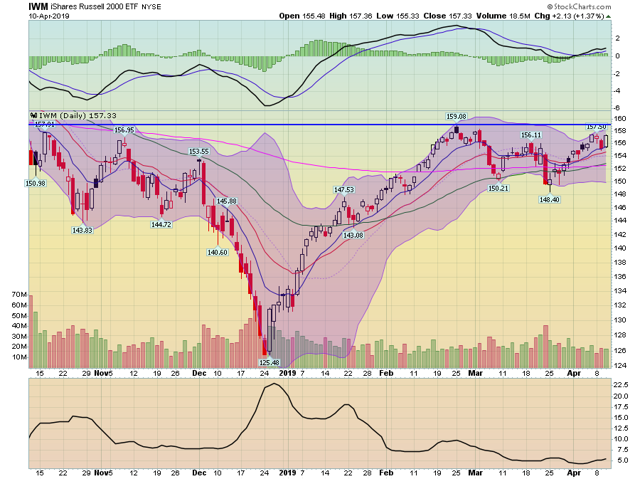
The IWM is right below its recent high of $157.50.
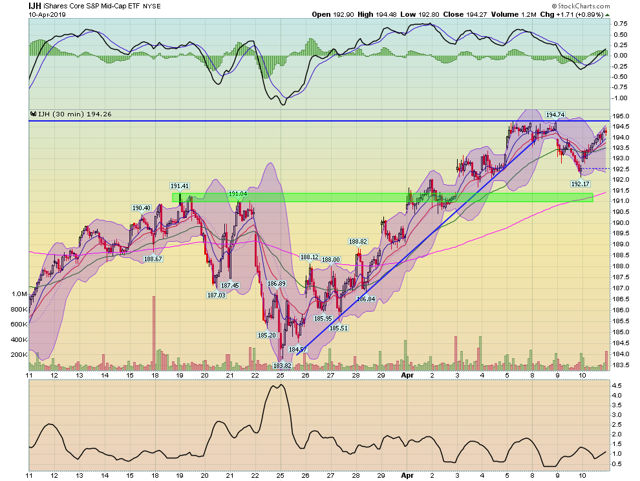
And the IJH remains below recent highs as well.
The daily charts are a bit more revealing and show additional technical weaknesses in the smaller-cap indexes.
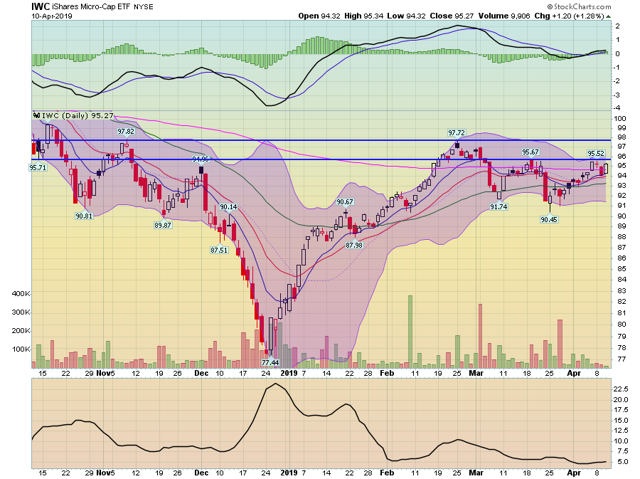
Micro-caps are still below two key technical levels while also being trapped at the 200-day EMA.
Small-caps have yet to break through the $159 price level.
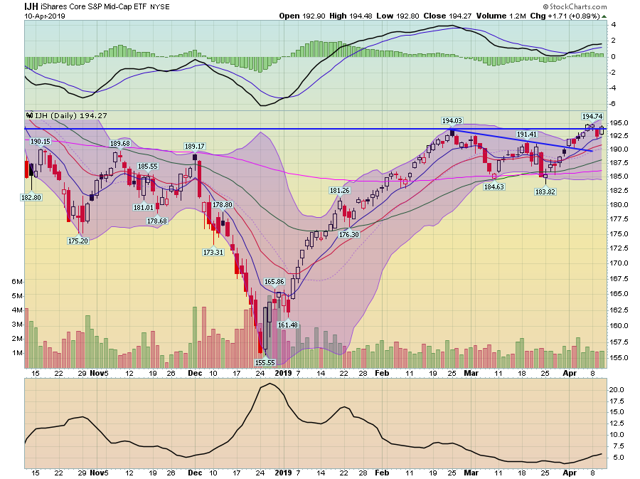
On the plus side, the IJH is right at technical resistance.
There is additional potential upside both fundamentally and technically. On the macro-side, it's obvious the Fed is now on the stock market's side which should provide some upside stimulus. And technically, all of the above charts have upside momentum room on their respective MACDs.
What we need to see is for the smaller-cap sections of the market to break-out and move through resistance which is keeping prices contained. If that happens, then we can say the bulls have come back. Until then, the jury is out.
Disclosure: I/we have no positions in any stocks mentioned, and no plans to initiate any positions within the next 72 hours. I wrote this article myself, and it expresses my own opinions. I am not receiving compensation for it (other than from Seeking Alpha). I have no business relationship with any company whose stock is mentioned in this article.

