Technically Speaking For April 9
Summary
- The latest JOLTs data is weaker, which is somewhat concerning.
- Global growth projections are declining.
- The 30-day charts are showing a pretty sharp change in tone.
How good was Friday's employment report?
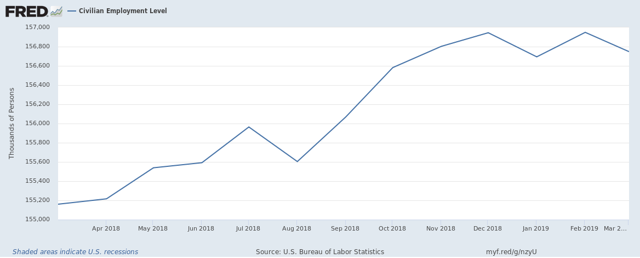
While most analysts (myself included) breathed a sigh of relief when we say Friday's headline number, David Rosenberg was less than impressed. On Twitter, he noted that job losses in retail, transportation, and manufacturing were signs that that job market was long in the tooth. Today, he observed that the JOLTs data contained a decline in job openings. As a result, he argues that the household survey - one of the two BLS labor market reports - is actually the more correct of the two. If that's the case, then we've got problems. Here's a 1-year chart of total employment from the household employment survey:
In this report, job gains have leveled off in the last four reports - a clear sign that we're nearer to the end of the expansion than the beginning.
Global Growth Projections are Heading Lower: Econbrowser -one of my favorite blogs -- has a guest post showing the decline in global growth projections. Here's a chart that shows the overall decline: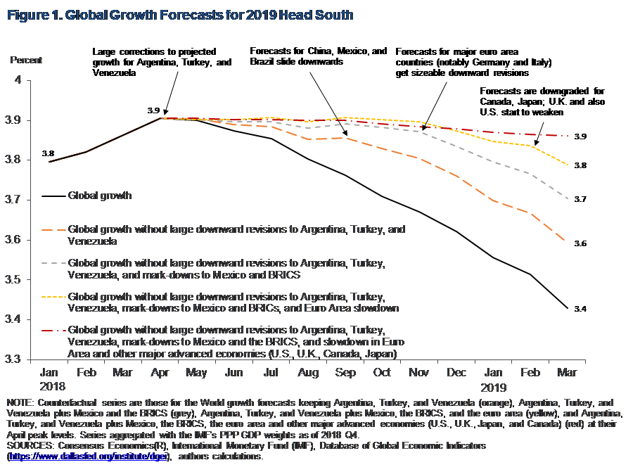
A number of factors have contributed to the decline in projected growth: Venezuelan problems, weakness in Brazil, Mexico, and China along with general trade tensions.
Is a recession in the cards? In my weekly Turning Points Newsletter, I've lower the recession probability in the next 6-12 months to 25%. However, Scott Grannis, a long-time blogger offers 10 charts that show there is no recession on the horizon. Among other indicators, he notes:
- Swap spreads are contained
- The long-end of the Treasury curve (the 30-10 spread) is widening
- Job growth is still strong
- Stocks are rallying
Right now, there is ample data for both the bullish and bearish economic argument, making it an especially difficult time to prognosticate.
The market has been incredibly difficult to read for the last few weeks. But the general economic thread that has been running through the charts is that traders are projecting slower growth. Today's performance table furthers that observation:
Treasuries outperformed today; the long-end of the curve was up modestly while the belly of the curve was up marginally. At the other end of the table are the risk-based equity indexes - the IWM, IJH, and IWC, all of which were down near the 1% mark. The larger-cap indexes fared somewhat better but were still off.
And the 30-minute charts are currently furthering the slow-growth narrative. Let's start with two bond market ETFs:
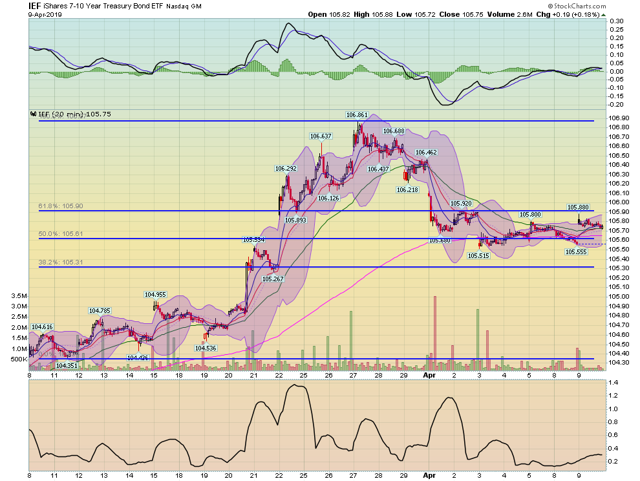
The IEF hit a 1-year high at the end of March. Since then, prices have sold off a touch, finding support at the 200-minute EMA which also corresponds to the 50% Fibonacci level.
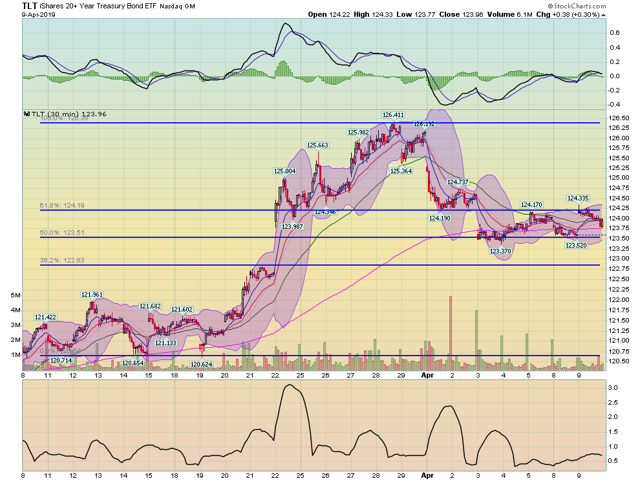
The TLT is following a similar path to the IEFs.
Notice that the Treasury markets price pattern could easily be described as simple profit-taking. Both the IEF and TLT remain at elevated levels.
Recent rallies in the IWC, IWM, and IJH are now over.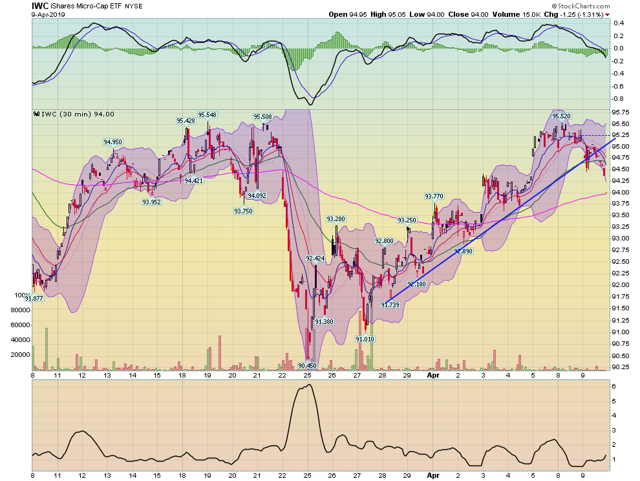
The IWC couldn't get above the mid-90s resistance from mid-March. Today, prices broke the trend line that connects various lows starting at the end of March. Momentum is declining. 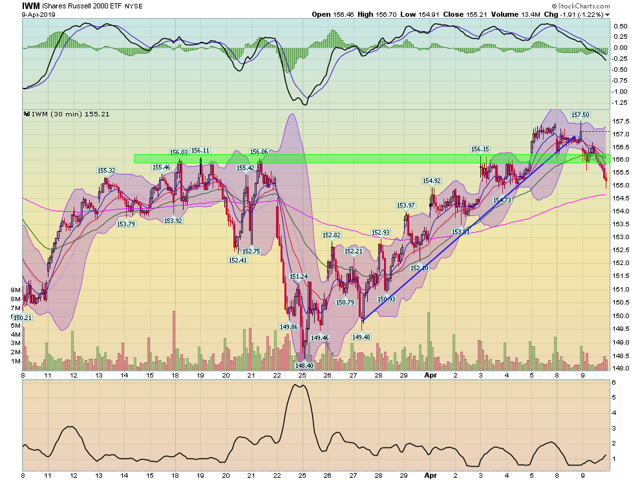
The IWM did get above the mid-150 level a few days ago. But in today's selloff, prices fell through that previous resistance level. Prices also broke the trend line of the latest rally. Momentum has taken a sharp turn lower.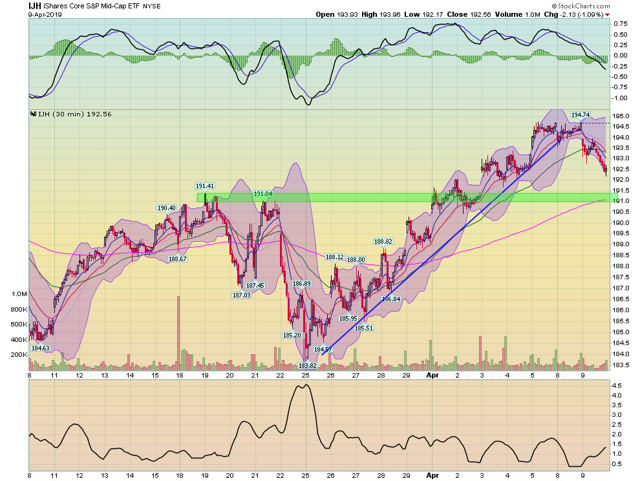
The IJH remains above highs from mid-March. But it too has broken the uptrend of the latest two-week rally.
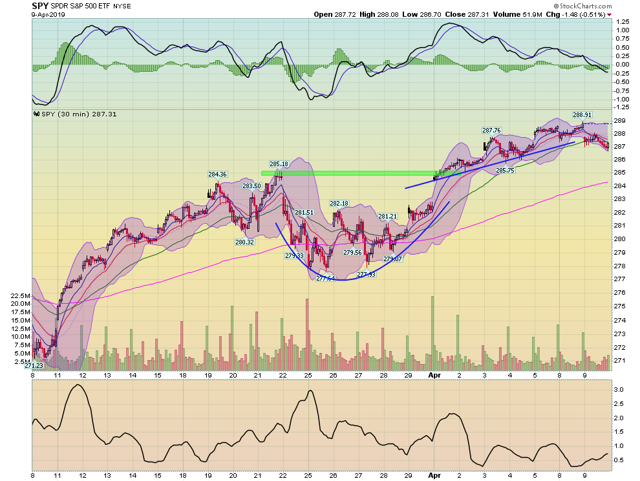
Finally, the SPY has also broken its trend.
Markets can always reverse course on good news, which could easily happen in the next few days. But today's 30-day prices charts all show a fairly sharp drop in bullish sentiment that would require an equally strong bullish tone to overcome.
Disclosure: I/we have no positions in any stocks mentioned, and no plans to initiate any positions within the next 72 hours. I wrote this article myself, and it expresses my own opinions. I am not receiving compensation for it (other than from Seeking Alpha). I have no business relationship with any company whose stock is mentioned in this article.

