In this past weekend’s missive I wrote:
“So…Should I “Buy The F*$(@!# NOKO?”
My best guess currently is – probably. But not yet.”
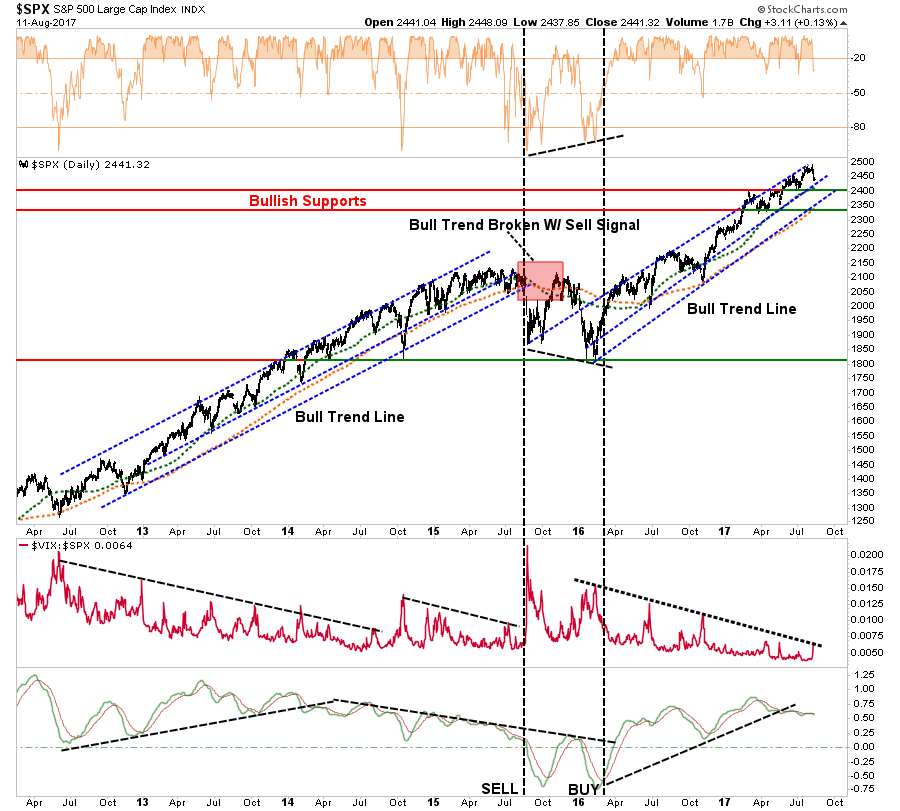
“In our portfolios, we will wait for confirmation the current sell-off has abated before adding additional risk exposure to portfolios. In recent years, such market tantrums have been very short-lived and have provided opportunistic entry points for increasing equity related exposure. However, EVERY TIME is DIFFERENT, so it is always important to NEVER ASSUME the outcome will be the same as the last. That is how you wind up losing a lot of money.
As shown in the chart above, with the market on a very short-term sell signal, and still very overbought, it will likely prove prudent to remain patient and see if the markets can regain more solid footing next week.”
Let me update that analysis.
On Monday, the market surged out of the gate as headlines suggested that “geopolitical risk” had subsided. I find this particular explanation hard to digest given the rising rhetoric of a potential trade war with China, violence in Charlotte over the weekend, no resolution with North Korea, etc., so forth, and so on. I find little evidence of a global turn in geopolitical stresses currently.
The most obvious explanation is that “algo’s” went on a “buy the dip” frenzy which has been evident following every small dip in the markets over the last several months. Notice in the chart below, each dip to the red dashed bullish trend line, regardless of the risk (French election, Comey, Valuations, etc.) have all been met by a rash of buying.
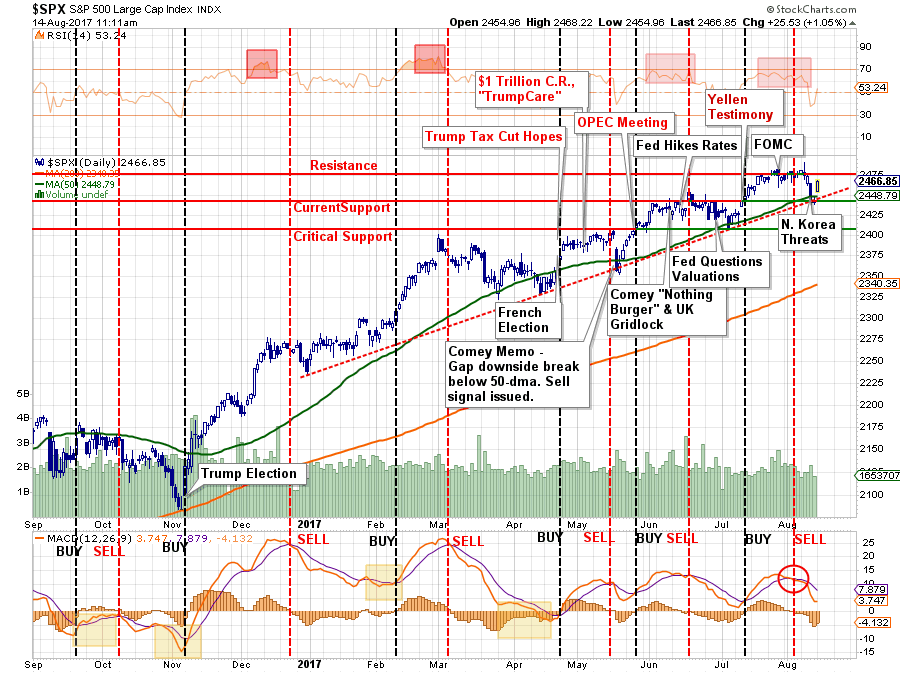
Monday’s “buy the dip” frenzy was no different. The question will be whether the market can both reverse the short-term “sell signal” and climb above the previous resistance of the old highs? Such a reversal would end the current consolidation process and allow for additional capital to be invested.
Importantly, this is very short-term analysis.
In this past weekend’s newsletter, I reviewed all of the S&P 500 sectors and the major markets for both risks and opportunities. Today, I want to also review of the positioning by institutions which reveal where “crowded trades” may exist for more contrarian portfolio positioning.
Positioning Review
The COT (Commitment Of Traders) data, which is exceptionally important, is the sole source of the actual holdings of the three key commodity-trading groups, namely:
- Commercial Traders: this group consists of traders that use futures contracts for hedging purposes and whose positions exceed the reporting levels of the CFTC. These traders are usually involved with the production and/or processing of the underlying commodity.
- Non-Commercial Traders: this group consists of traders that don’t use futures contracts for hedging and whose positions exceed the CFTC reporting levels. They are typically large traders such as clearinghouses, futures commission merchants, foreign brokers, etc.
- Small Traders: the positions of these traders do not exceed the CFTC reporting levels, and as the name implies, these are usually small traders.
The data we are interested in is the second group of Non-Commercial Traders.
This is the group that speculates on where they believe the market is headed. While you would expect these individuals to be “smarter” than retail investors, we find they are just as subject to human fallacy and “herd mentality” as everyone else.
Therefore, as shown in the series of charts below, we can take a look at their current net positioning (long contracts minus short contracts) to gauge excessive bullishness or bearishness. With the exception of the 10-Year Treasury which I have compared to interest rates, the others have been compared to the S&P 500.
Volatility
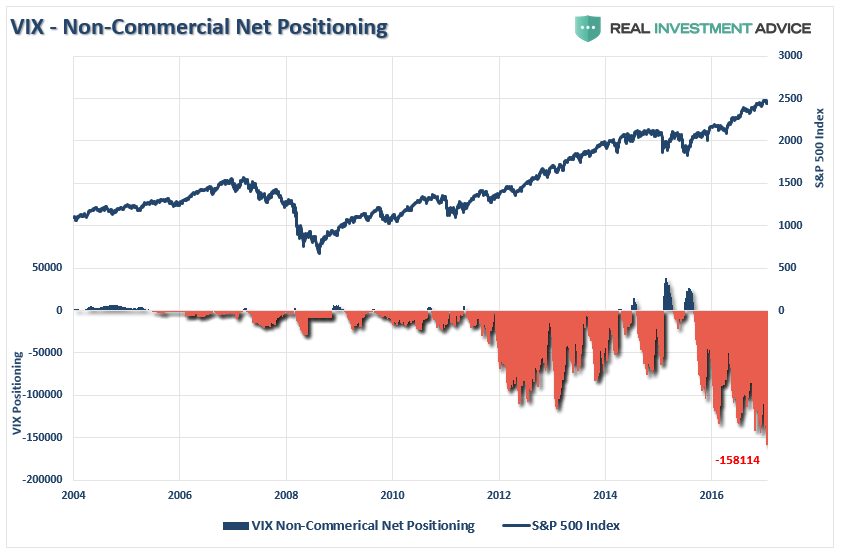
The extreme net-short positioning on the volatility index suggests there will be a rapid unwinding of positions given the right catalyst. As you will note, reversals of net-short VIX positioning has previously resulted in short to intermediate-term declines. With the largest short-positioning in volatility on record, the rush to unwind that positioning could lead to a much sharper pickup in volatility than most investors can currently imagine.
Crude Oil
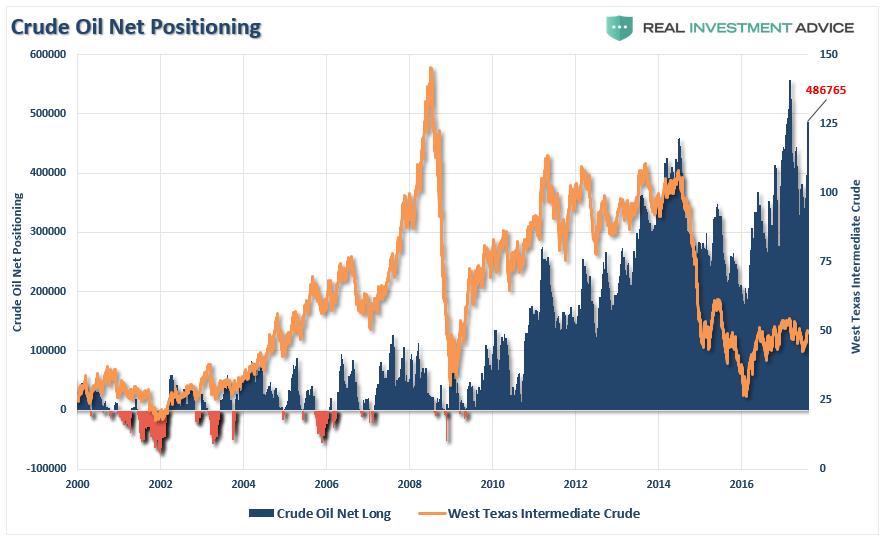
The recent attempt by crude oil to get back to $50/bbl coincided with a “mad rush” by traders to be long the commodity. For investors, it is also worth noting that crude oil positioning is also highly correlated to overall movements of the S&P 500 Index. With crude traders currently extremely “long,” a reversal will likely coincide with both a reversal in the S&P 500 and oil prices being pushed back towards $40/bbl.
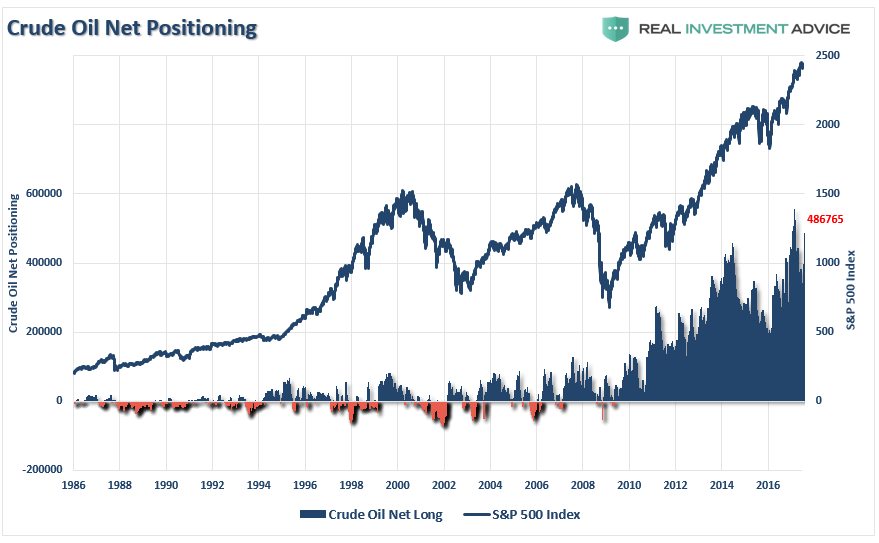
While oil prices could certainly fall below $40/bbl for a variety of reasons, the recent bottoming of oil prices around that level will provide some support. Given the extreme long positioning on oil, a reversion of that trade will likely coincide with a “risk off” move in the energy sector specifically. If you are overweighted energy currently, the data suggests a rebalancing of the risk is likely advisable.
US Dollar
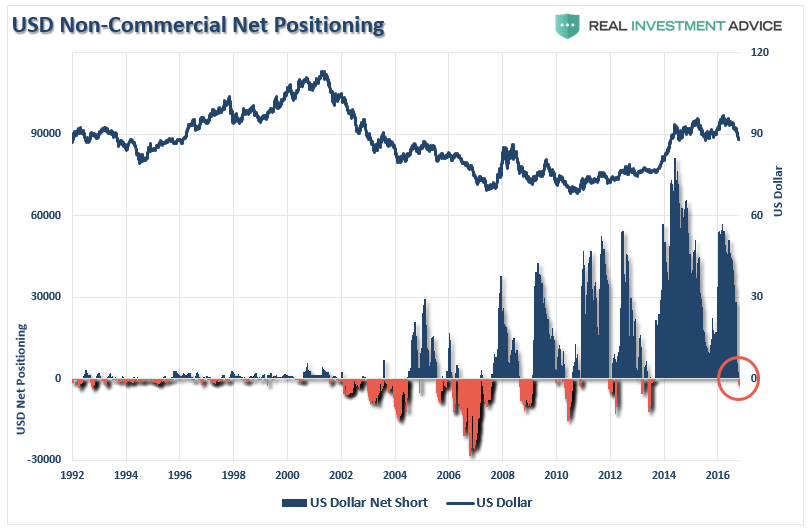
Recent weakness in the dollar has been used as a rallying call for the bulls. However, the recent reversal of US Dollar positioning has been extremely sharp and has led to a net-short position.
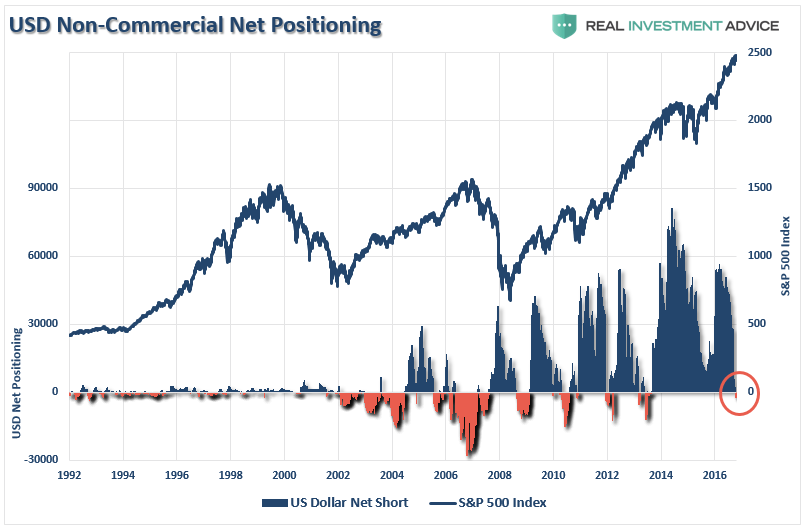
As shown above, and below, such negative net-short positions have generally marked both a short to intermediate-term low for the dollar as well as struggles for the S&P 500 as a stronger dollar begins to weigh on exports and earnings estimates.
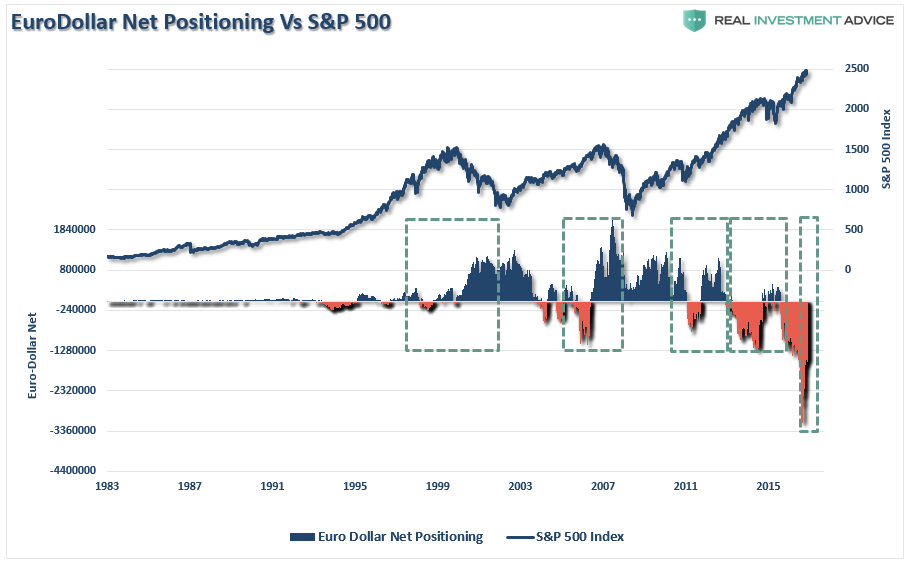
It is also worth watching the net-short positioning the euro-dollar as well which has also begun to reverse in recent weeks. Historically, the reversal of the net-short to net-long positioning on the Eurodollar has often been reflected in struggling financial markets.
Interest Rates
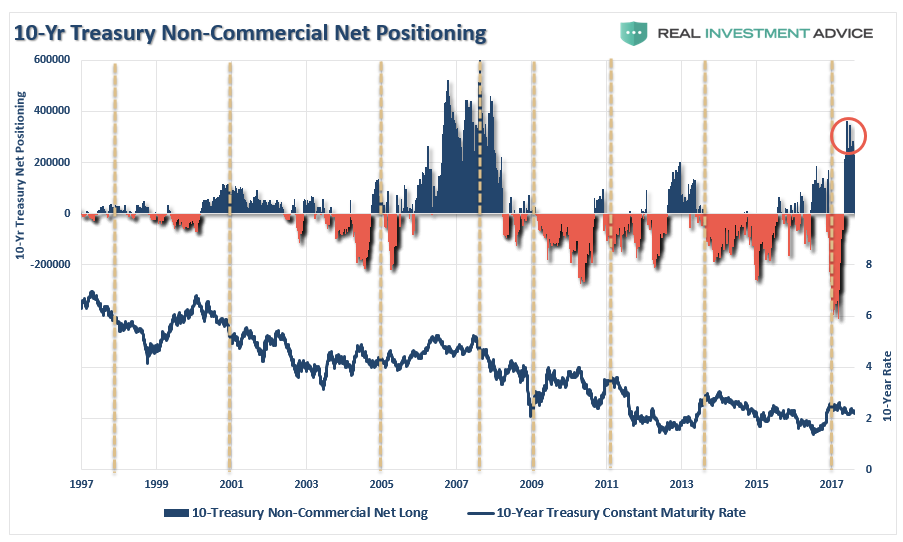
One of the biggest conundrums for the financial market “experts” is why interest rates fail to rise. Apparently, traders in the bond market failed to get the “memo.” With the net positioning in bonds at some of the highest levels since the financial crisis, there is little reason to believe the “bond bull” market is over. Look for a reversal of the current positioning to push bond yields lower over the next few months.
Smart Vs. Dumb Money
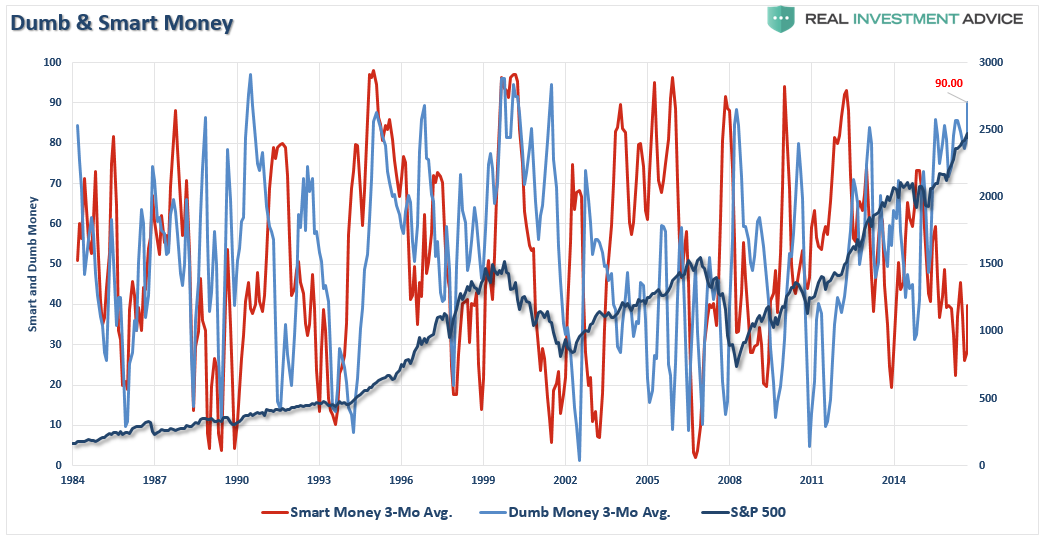
While we have been looking at solely the large noncommercial traders above, they are not the only ones playing in the future markets. We can also dig down into the overall net exposure of retail investors (considered the “dumb money”) versus that of the major institutional players (“smart money”)
The first chart below shows the 3-month moving average of both smart and dumb-money players as compared to the S&P 500 index. With dumb-money running close to the highest levels on record, it has generally led to outcomes that have not been favorable in the short-term.
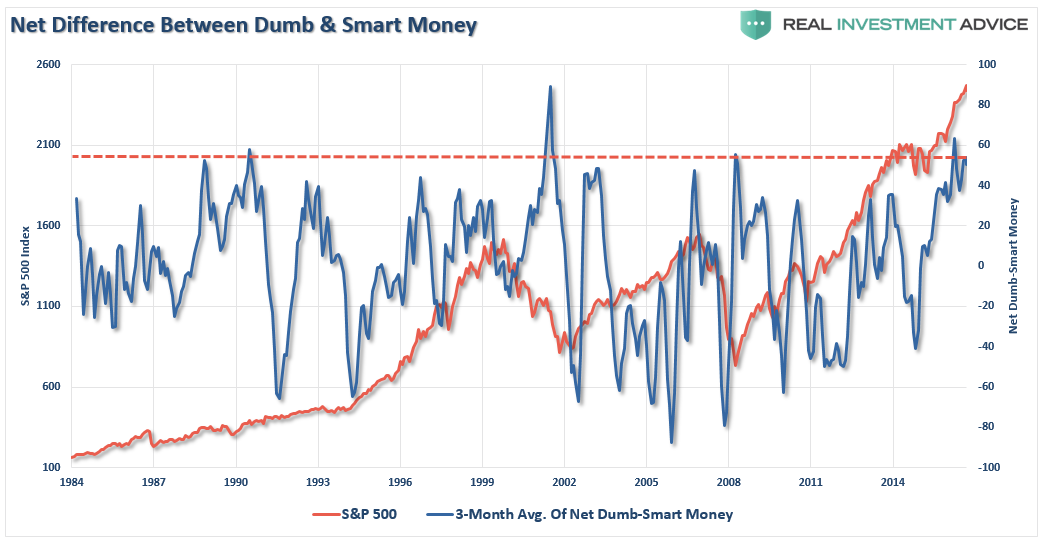
We can simplify the index above by taking the net-difference between the two measures. Not surprisingly, the message remains the same. With the confidence of retail investors running near historic peaks, outcomes have been less favorable.
None of this analysis suggests that a market “crash,” or even a moderate correction, is about to occur tomorrow.
What it does suggest is that investor risk is elevated, with the majority of investors are all bunched up on “one side of the trade,” which has led to poor investor outcomes historically.
Of course, it is not just these issues noted above but also, as I have discussed previously, the issue of excess in:
- Leverage – both in margin and corporate debt.
- Bullish Sentiment
- Valuations
- The “High-Yield” Chase
- Market Capitalization Ratios
“Complacency” is the weapon of our own demise. It reminds me of the following quote:
“Fair weather cannot always continue. The Economic Cycle is in progress today as it was in the past. The Federal Reserve System has put the banks in a strong position, but it has not changed human nature. More people are borrowing and speculating today than ever in our history.
Sooner or later a crash is coming and it may be terrific. Wise are those investors who now get out of debt and reef their sails. This does not mean selling all you have, but it does mean paying up your loans and avoiding margin speculation. Sooner or later the stock market boom will collapse like the Florida boom. Some day the time is coming when the market will begin to slide off, sellers will exceed buyers, and paper profits will begin to disappear. Then there will immediately be a stampede to save what paper profits then exist.” – Roger Babson, September 5th, 1929.
The more things change…the more they remain the same.
