In this past weekend’s newsletter, we discussed the exceedingly deviated price and overbought conditions. When we combine the technical backdrop with the “bulls going ballistic,” it once again makes sense to reduce risk in our portfolios.
“The rally from the October lows was a ‘sellable rally.’ The current rally is as well. Given the more overbought condition, we expect a one to two-week correction at the beginning of December as mutual funds make their annual distributions.
While it is feasible, the markets will end the year positively; we will likely see a better entry point first. “
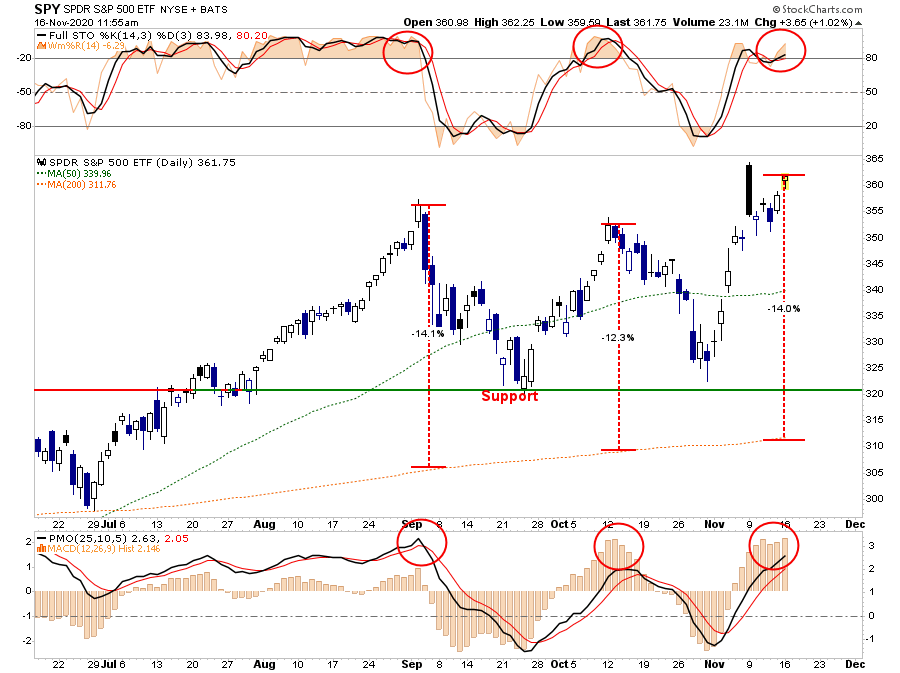
These more extreme overbought, extended conditions rarely last long. We reduced our risk exposure in our portfolios yesterday morning:
“The market has gotten back to more extreme overbought, extended and bullish levels. Historically, such a setup has led to short-term corrections, or worse.
While the vaccine news this morning is certainly welcome, the markets have already priced much of that into stocks currently. Considering a vaccine won’t be widely available to mid-to late-next year, the economic weakness will continue to weigh on profitability for now.
As such, we are taking profits in some of our more egregiously extended positions and will use a post-Thanksgiving correction to add back to holdings at a cheaper level.”
Risk Begets Risk
Not surprisingly, I received more than a few emails chastising me for “bailing on the bull market, which is going higher.”
Such is hardly the case. We reduced our weighting in some of the companies which have had substantial gains over the last year. We remain primarily long-biased in our portfolios, but given the extreme technical overbought and deviated conditions; it was prudent to raise some cash and protect our gains.
Interestingly, such was also a point made in this past weekend’s newsletter:
When people believe that they need to take ‘a little more risk’ to generate greater returns, they may be making a very BIG mistake if they underestimate what ‘risk’ really means to them.”
As we noted in “Moral Hazard,” the Federal Reserve believes that insuring people against investment losses is a dangerous one. While investors are encouraged to take more risk currently, as prices rise, they begin to disregard risk for what it is.
When people take “a little risk” and get rewarded for it, they are then encouraged to take “a little more risk.”
“People in the ‘crowd’ don’t appreciate the risks they are taking because they’re surrounded by people who believe the market will keep going up.”
Bullish Outbreaks
However, it wasn’t just the conditions we discussed, which have us concerned about the markets in the short term. Investor positioning has also reached rather extreme levels. As Bob Farrell once wrote:
“Investors buy the most at the top, and the least at the bottom.”
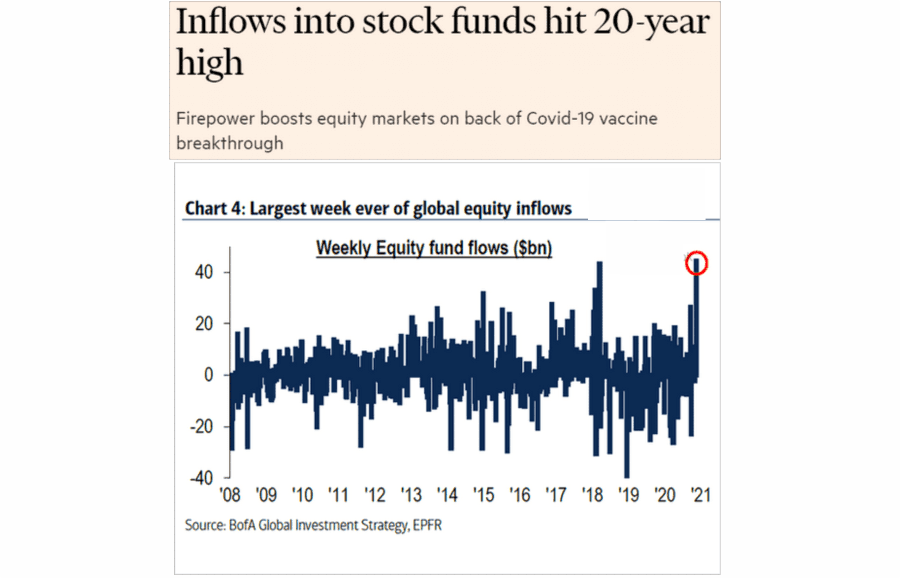
Following the election, investors aggressively added to their equities. The last time we saw this type of surge was in December of 2017, followed by a near 20% decline just two months later.
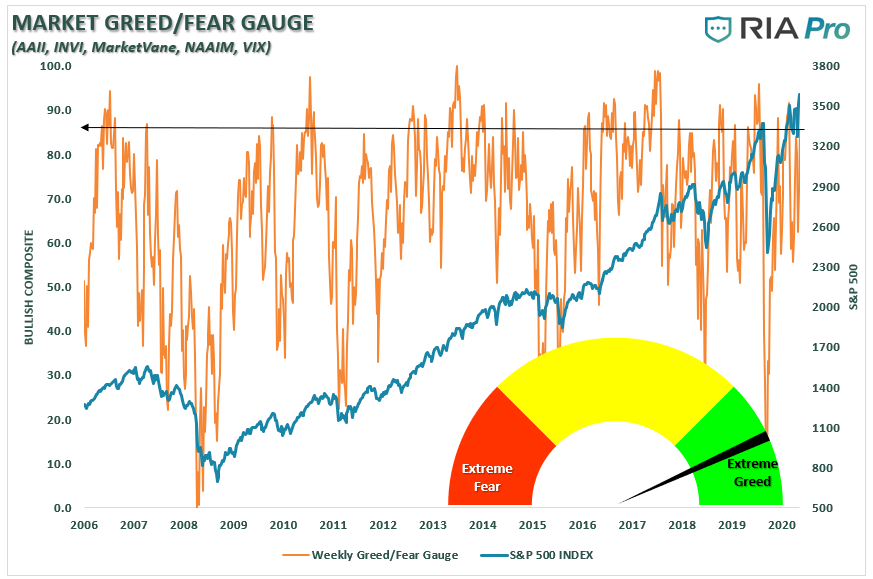
Our composite “fear/greed” indicator, which primarily comprises investor positioning, shows much of the same as “bullish sentiment” pushes back to extremes.
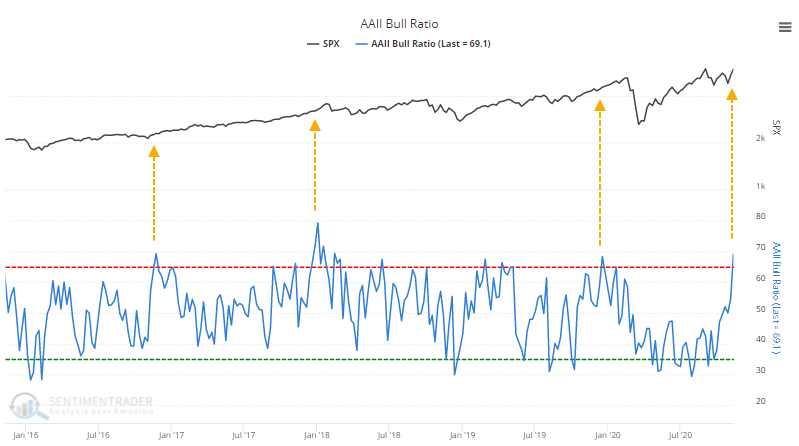
Most notably was the AAII bullish sentiment, which has remained suppressed since March. All of a sudden, they decided it was time to get bullish again. As noted:
The percentage of bulls in the American Association of Individual Investors (AAII) survey rose to 55.8% while bears dropped to 24.9%, pushing the Bull Ratio, a more accurate measure of optimism, above 69%. The last 2 times it got this high, stocks ended up running into trouble eventually.” – SentimenTrader
Technical Extremes
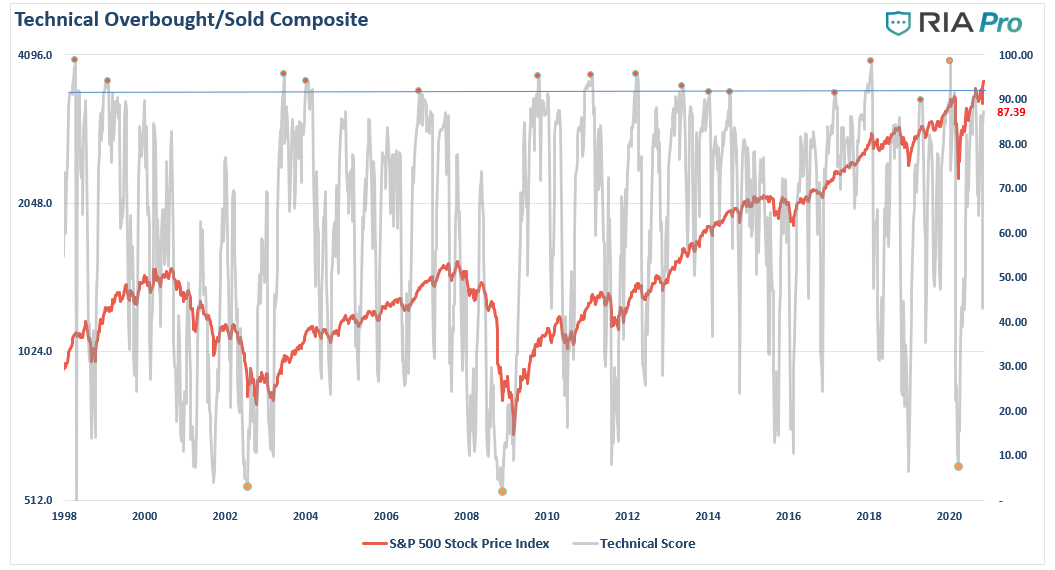
Below is the latest updated technical composite score. This hybrid gauge combines extension, deviation, and momentum into a single weekly measure. Readings above 85 (Currently 87.39) are always associated with short-term corrective actions in the market.
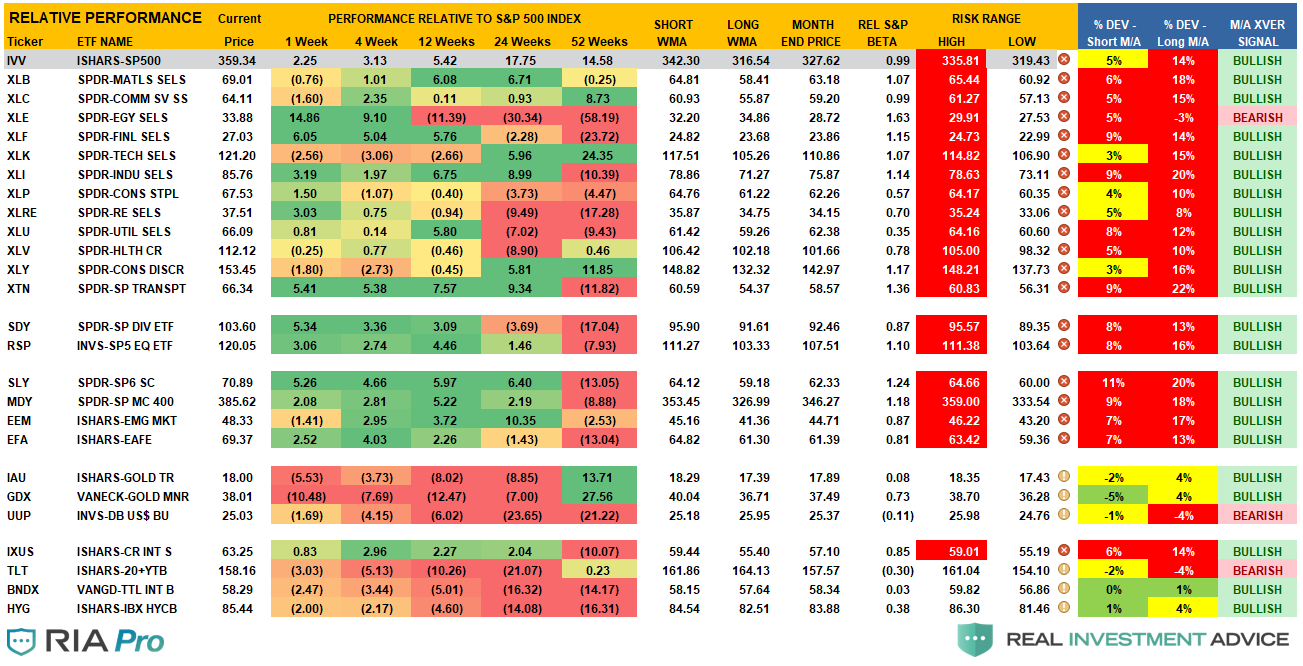
Our risk/reward range table is also sending an important warning. With deviations from the long-term weekly moving averages at extremes and prices well outside of regular monthly price changes, short-term corrections have been nearby.
With all of these conditions aligned, the “probability” of a short-term correction has increased. Given that risk outweighs reward in the short-term, we decided it was prudent to reduce that equation’s numerator.
It May Be Time To Be Contrarian
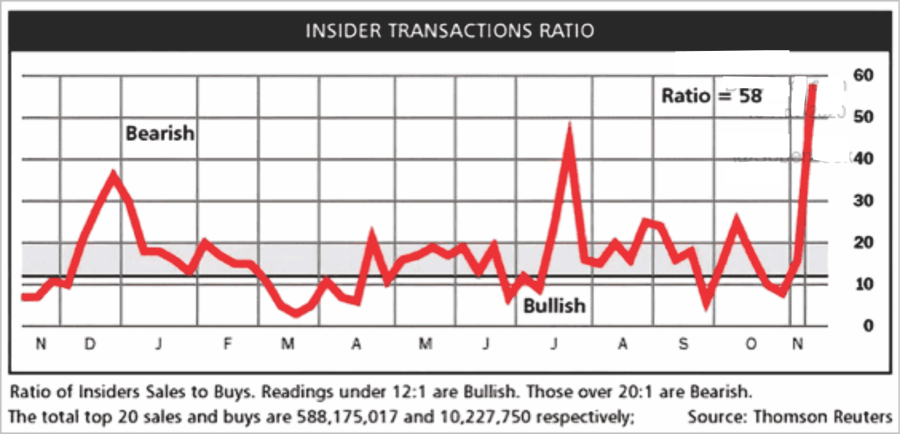
While reducing risk currently may seem a bit premature, some other signs suggest that markets are well ahead of themselves. “Insider selling” has reached more important extremes and typically coincides with short-term market corrections.
Also, as Michael Lebowitz pointed out in the newsletter:
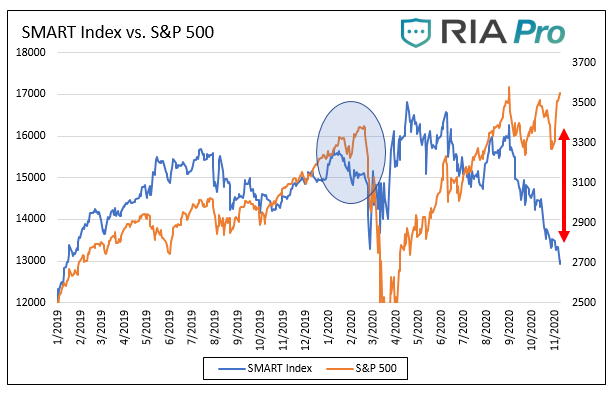
Bloomberg’s Smart Money Flow Index is a measure of how ‘smart money’ is positioning itself in the S&P 500. The logic behind the index is that smart investors tend to trade near the end of the day, while more emotional-based traders dominate activity in the first 30 minutes of the trading day. The index is calculated as follows: yesterday index level – the opening gain or loss + change in the last hour.
As shown below, the Smart Index and the S&P were well correlated until late August. Since then, as highlighted by the red arrow, they have diverged sharply. Over the last ten years, the S&P 500 and the Smart Index have a strong correlation of .65. As such, we expect they will converge in time. The light blue circle shows they also diverged, albeit to a much lesser extent, in January and February as the smart money correctly sensed problems.”
By reducing risk now, it provides us three benefits for the future.
- Less equity risk, and higher cash levels, lower the portfolio’s volatility, which will allow us to navigate a correction process and protect our investment capital.
- It gives us capital to reinvest back into positions we currently own at better prices; or,
- Buy new positions which have corrected in price.
While it is entirely true that “you can not time the market,” you can manage the risk of capital loss.
Buy The Rumor. Sell The News.
Jeffrey Marcus summed up our thoughts well in his Monday morning post:
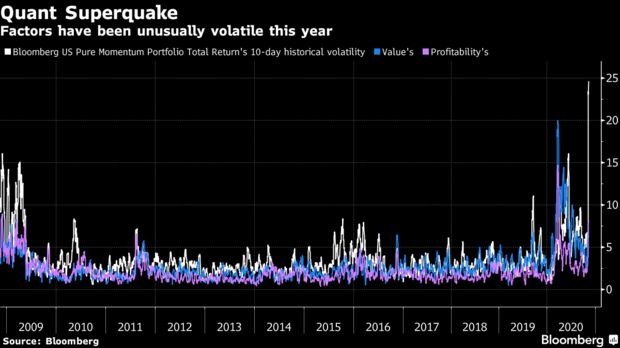
“The recent rally has been driven by the former losers and much of this performance happened after the PFEs 11/9 announcement of very positive vaccine data. The moves since 11/9 are so dramatic that they have destroyed many statistical models.
Jon Quigley who manages $3.8 billion wrote to clients, that events that happened statistically should never happen. The occurrence statistically only happens roughly once every:
‘5,944,505,312,905,660,000,000,000,000,000,000,000,000,000,000,000,000,000,000,000,000,000,000,000,000,000 days in a normally-distributed return series, (Bloomberg 11/13/20).’
How long exactly is that? It equates to roughly
- 1 in every 1.629 x 10^76 years, OR
- 1.2 x 10^66 age of the universe.
“In a market run in part by models, machines, and day-traders, this probably should not have been a surprise. Its not a coincidence were seeing more 6 sig+ moves relative to history, Cem Karsan, founder of Aegea Capital Management LLC, tweeted, using the symbol denoting standard deviation.
These arent your fathers equity markets.
Jeff concludes with two questions.
- Is the current relative performance pattern sustainable?
- Should we now expect more fat-tail events?
His answers were simplistic:
- Maybe not; and,
- Definitely.
We Play The Probabilities
The probability is that we will see another 5-10% correction in the not too distant future. Such was the same call we made in February, August, and early October.
While many will read this article as being “bearish,” it isn’t.
As portfolio managers, we manage the risk of capital loss against the potential for reward. In other words, we “we prepare for the probabilities, but leave room to adjust for the possibilities.”
No one knows with certainty what the future holds, which is why we must manage portfolio risk accordingly and be prepared to react when conditions change.
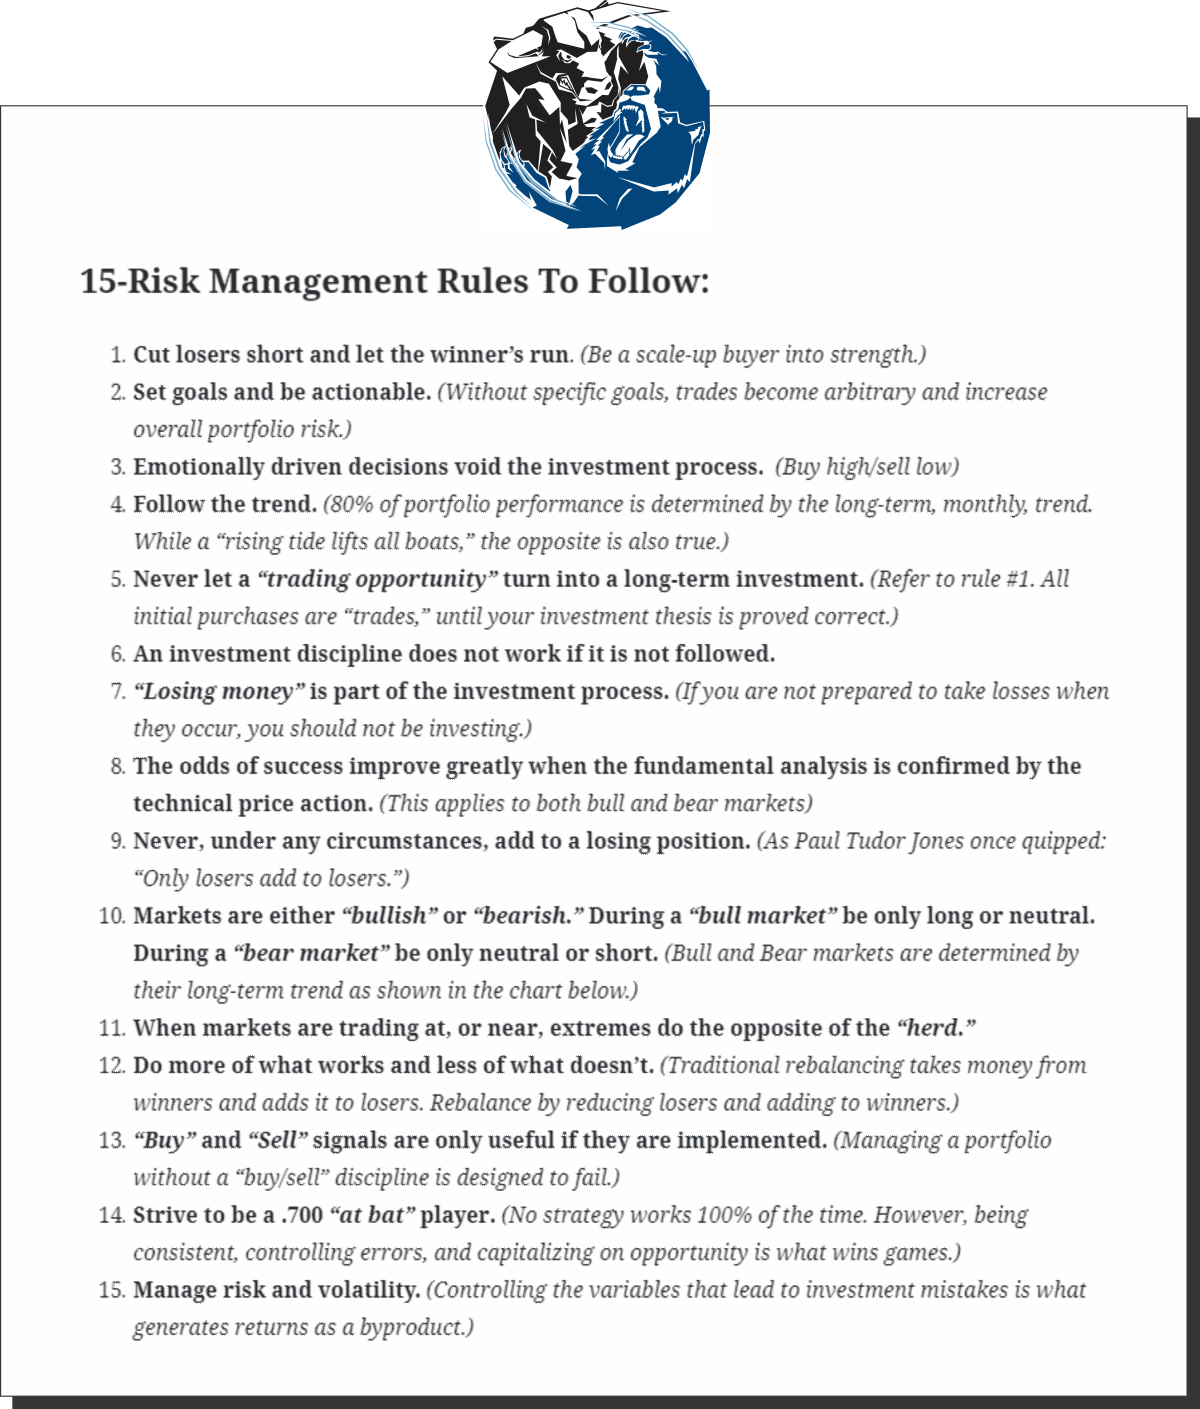
While I am often tagged as “bearish” due to my analysis of economic and fundamental data for “what it is” rather than “what I hope it to be,” I am neither bullish nor bearish. I follow a straightforward set of rules that are the core of my portfolio management philosophy, focusing on capital preservation and long-term “risk-adjusted” returns.
The current market advance has pushed back to more extreme bullish positioning. How long it can last is anyone’s guess. However, remember that markets ebb and flow around long-term moving averages. When markets rise too far above them, “gravity” tends to take over.
Everyone approaches money management differently.
Such is just the way we do it.

