Summary
Three central banks lowered rates in the last 24 hours. The Bank of India cut rates 35 basis points, noting, "Global economic activity has slowed down since the meeting of the MPC in June 2019, amidst elevated trade tensions and geopolitical uncertainty." The Bank of New Zealand cut rates 50 basis points, noting, "Global economic activity continues to weaken, easing demand for New Zealand’s goods and services. Heightened uncertainty and declining international trade have contributed to lower trading-partner growth. Central banks are easing monetary policy to support their economies." And Thailand cut rates 25 basis points, noting, "the Committee assessed that the Thai economy would expand at a lower rate than previously assessed due to a contraction in merchandise exports, which started to affect domestic demand." All banks noted declining trade and rising global tensions as a reason for their changes in policy.
Global markets are all taking it on the chin:
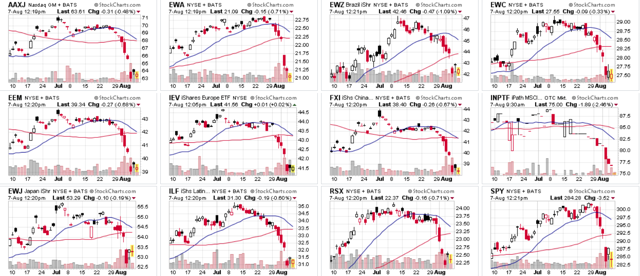
Above are 12, 2-month charts of ETFs that track a majority of the major global markets. All are lower. Some started to trend lower at the beginning of the month; some dropped more sharply with the SPY (NYSE:SPY) selloff. All have gapped lower this week. Put more directly, the selloff is global and was, to a certain extent, telegraphed by modest declines over the last few weeks.
Meanwhile, bond markets are catching a strong bid:
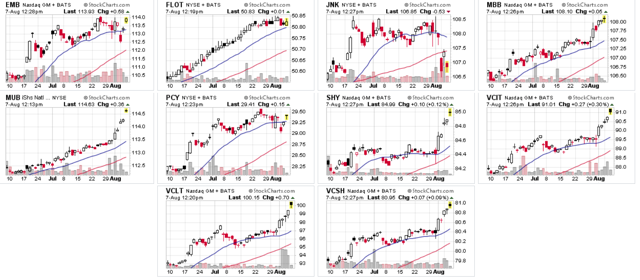
Above are 10 charts of ETFs that track various bond markets. With the exception of JNK (top row, second from right), EMB (top row, far left) and PCY (middle row, second from left), all have moved sharply higher over the last few trading sessions. Remember that bond markets typically don't move by such large amounts. The size of the move indicates a major risk aversion among investors and traders.
Let's turn to today's performance table:
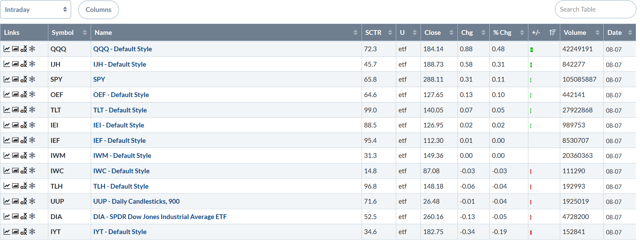
Not a bad day for the markets -- especially considering the large drop at the open. The QQQ was the best performer, followed by mid-caps and the S&P 500. However, Treasuries also rose on the day and small-caps were off modestly.
There was a fair amount of press about today's turnaround. And in the short term, it appears that the markets could be forming a short-term (3-5 day) bottom. Here's the two-week chart:
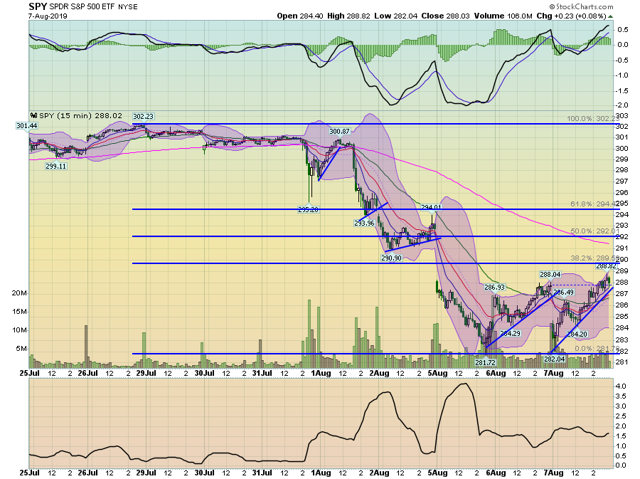
A technician could argue that the chart is forming a short-term double-bottom, with lows at the end of August 5 and opening of August 7. Assuming that plays out, prices would be expected to rally to one of the Fibonacci levels. However, notice a large number of failed rallies in this chart -- there have been four in the last five days.
Also arguing for the short-term bottom (3-5 days) is the IEF chart:
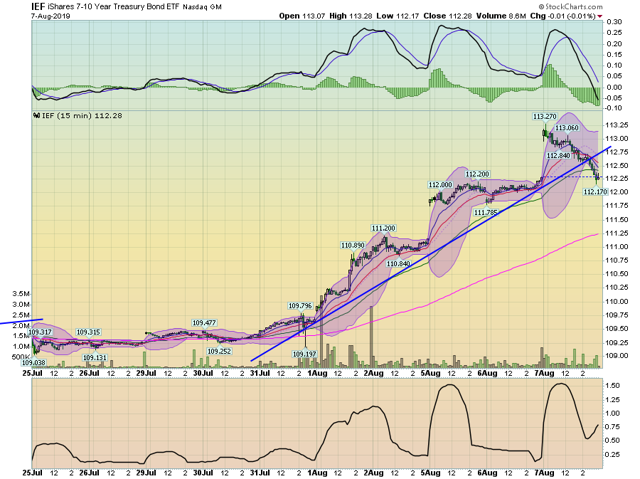
The IEF broke a short-term uptrend today.
But, based on current charts, any counter-rally would be a dead-cat bounce. The reason is found in the daily charts:
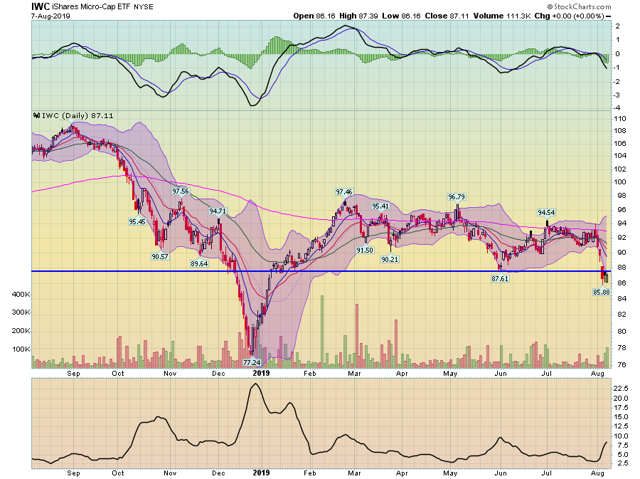
Micro-caps are consolidating below lows from late May -- where there is little meaningful technical support. Prices are already below all the moving averages.
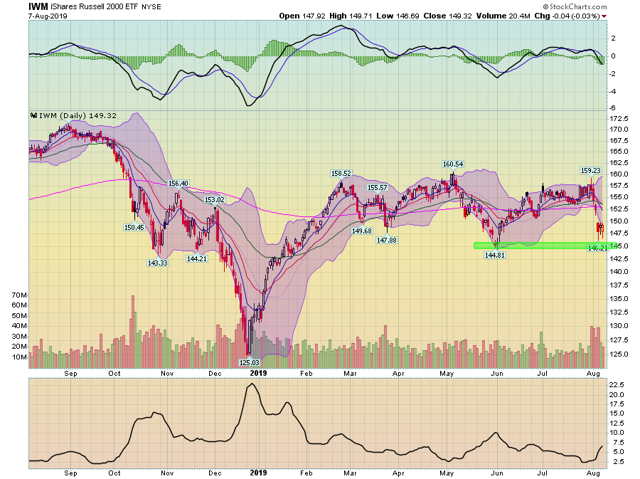
Small-caps are consolidating right above technical support from late May. As with the micros, small-caps are below all EMAs.
And then we have the Treasury market rally:
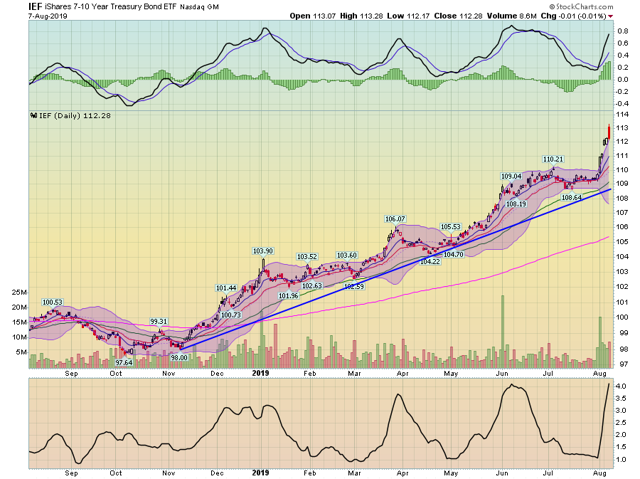
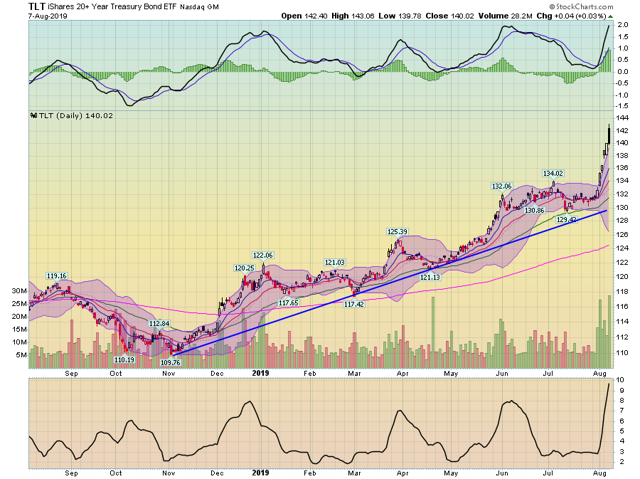
The IEF is going parabolic -- a very rare development for the Treasury market ...
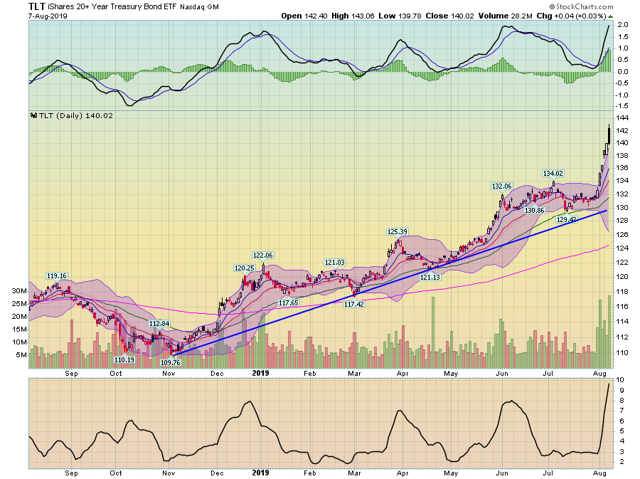
... as is the TLT.
Against this background is an increasingly fraught fundamental backdrop. Central banks are obviously getting nervous, leading them to cut rates. China and the US are engaged in what will probably amount to a long-standing zero-sum game. And global manufacturing is clearly slowing. All of this keeps my short and long-term projections bearish.
Disclosure: I/we have no positions in any stocks mentioned, and no plans to initiate any positions within the next 72 hours. I wrote this article myself, and it expresses my own opinions. I am not receiving compensation for it (other than from Seeking Alpha). I have no business relationship with any company whose stock is mentioned in this article.
