- Monitoring purposes SPX: Neutral
- Monitoring purposes Gold: Short GDX on 8/22/16 at 29.46.
- Long-Term Trend monitor purposes: Short SPX on 1/13/16 at 1890.28

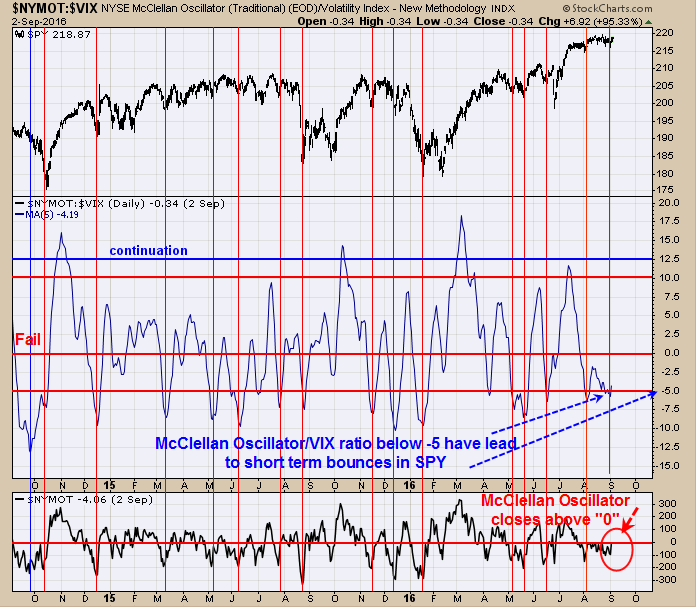
The middle window is the NYSE McClellan Oscillator/VIX ratio. When this ratio has closed below -5 it has been a bullish short term condition for the market. Last Thursday this ratio closed below -5 and marked a short term low for the SPY. When this ratio gets above “0” it has been and area where a short term position can safely be considered. When this ratio is below “0” and above “-5” the market tends to be buoyant. This ratio closed at “minus 4.06” last Friday and may be a bit higher today but below “-5” suggesting market may stay buoyant short term. Possible short-term target near 220 on the SPY.

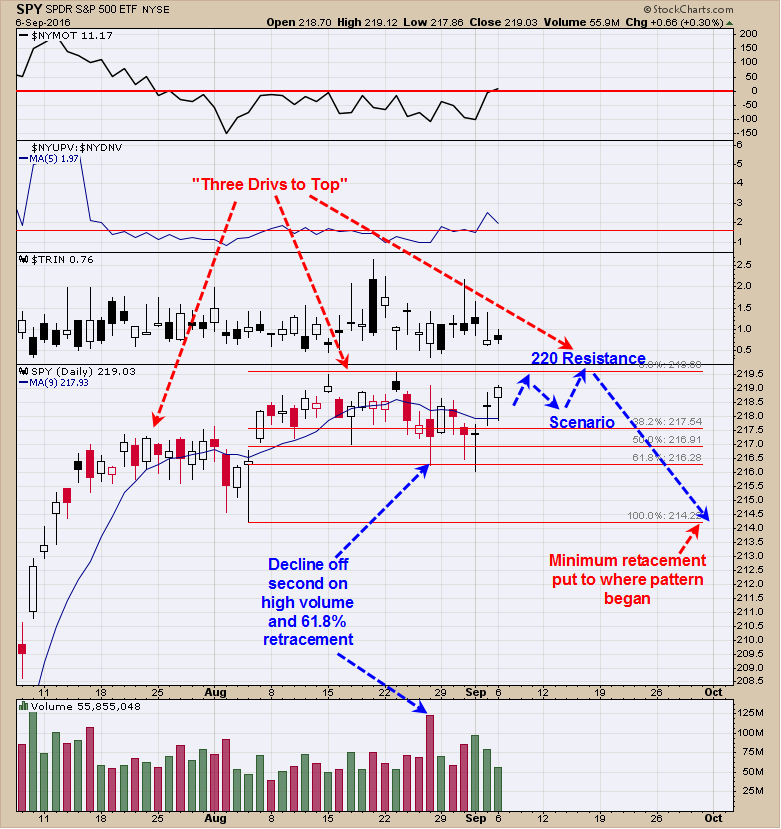
Timer Digest has the Ord Oracle (NYSE:ORCL) ranked 9th in performance for the last 12 months updated 8/24/16. Here is the detailed pattern that appears to be playing out which is the “Three Drives to Top”. The key element that a “Three-Drives-to-Top” pattern is in play if for the decline off the second top retraces at least 61.8% of the previous rally and volume on that retracement is high. As you can see on the chart those requirement where met. What comes next is another rally to new highs to complete the “Third Top”. The “Third Top” should show volume divergences as well as other divergence indicators such as the VIX to show the “Third top” is the final top. There is resistance around the 220 on the SPY which is our upside target for now. “Three Drives to Top” have a minimum downside target where to where the pattern began and in this case a 214 target is possible. There is a bigger pattern where a target to 200 is possible but we will get to that at a later time. According to Seasonal charts a top should form in late August to early September which could produce a decline into October to November. Still neutral for now.

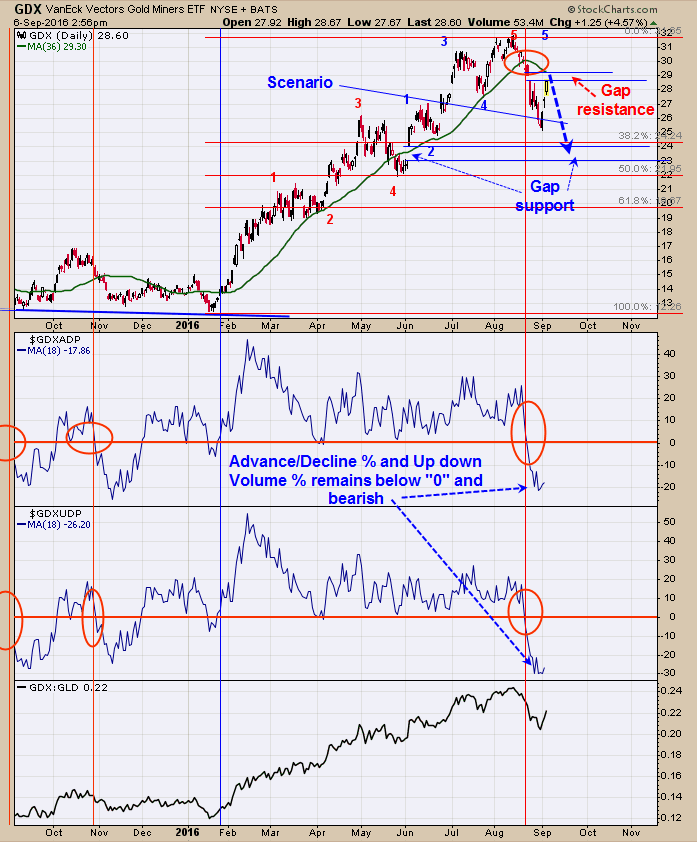
GDX tested the gap level that formed on June 24 near the 25.50 range and found support and as rallied back the upper gap that formed on August 24 near 29.00 and should now find resistance. Both Advance/Decline percent and Up down volume Percent are below “0” suggesting the larger trend is still down. A close above “0” on these indicators would suggest the trend has turned back to bullish. The pattern that appears to be forming here is an ABC where “A” may have completed near the 25.00 range on GDX and “B” wave up may complete near gap at 29.00 level before “C” wave down takes GDX to its final low that could bottom in the 23 range (open gap June 3 in the 23 range). There is a major cycle low due in mid October where the final low may form which could come in the 23 to 22 range on GDX. We are short the GDX on 8/22/16 at 29.46.
