Negative rate in Japan
The Bank of Japan (BoJ) unexpectedly introduced the negative interest rates at -0.1% aimed at stimulating national economic growth and inflation growth to the 2% target. The Bank left the QE volume unchanged at 80bn. yens a year and stated that the banks will be fined for the surplus assets storage on the BoJ accounts. All these moves pushed the yen exchange rate much lower and triggered the rally in the Japanese stocks. Will the Nikkei index continue edging up?
The ECB was the first to introduce the negative interest rates in June 2014 which had a positive effect on European economy. Last week the BoJ Governor Haruhiko Kuroda stated the Bank was not considering going negative. Consequently, the negative rates surprised the markets causing strong reaction. Now analysts believe the rate may hit 125 yens per US dollar. In our opinion, the consensus forecast shows the further weakening by the Bank in unlikely. Chances are it will continue easing monetary policy by expanding QE volume while the bond-buying program is to last till 2017 at least. For the Japanese companies this means almost free credit and partial writing down of their debts thanks to the redemption of bonds. Moreover, the weak yen raises the income and competitiveness of the Japanese exporters. All mentioned above may contribute to the further Nikkei growth. The further economic data will come out in Japan on February 4 and 5 – the forex reserves and PMI indices.

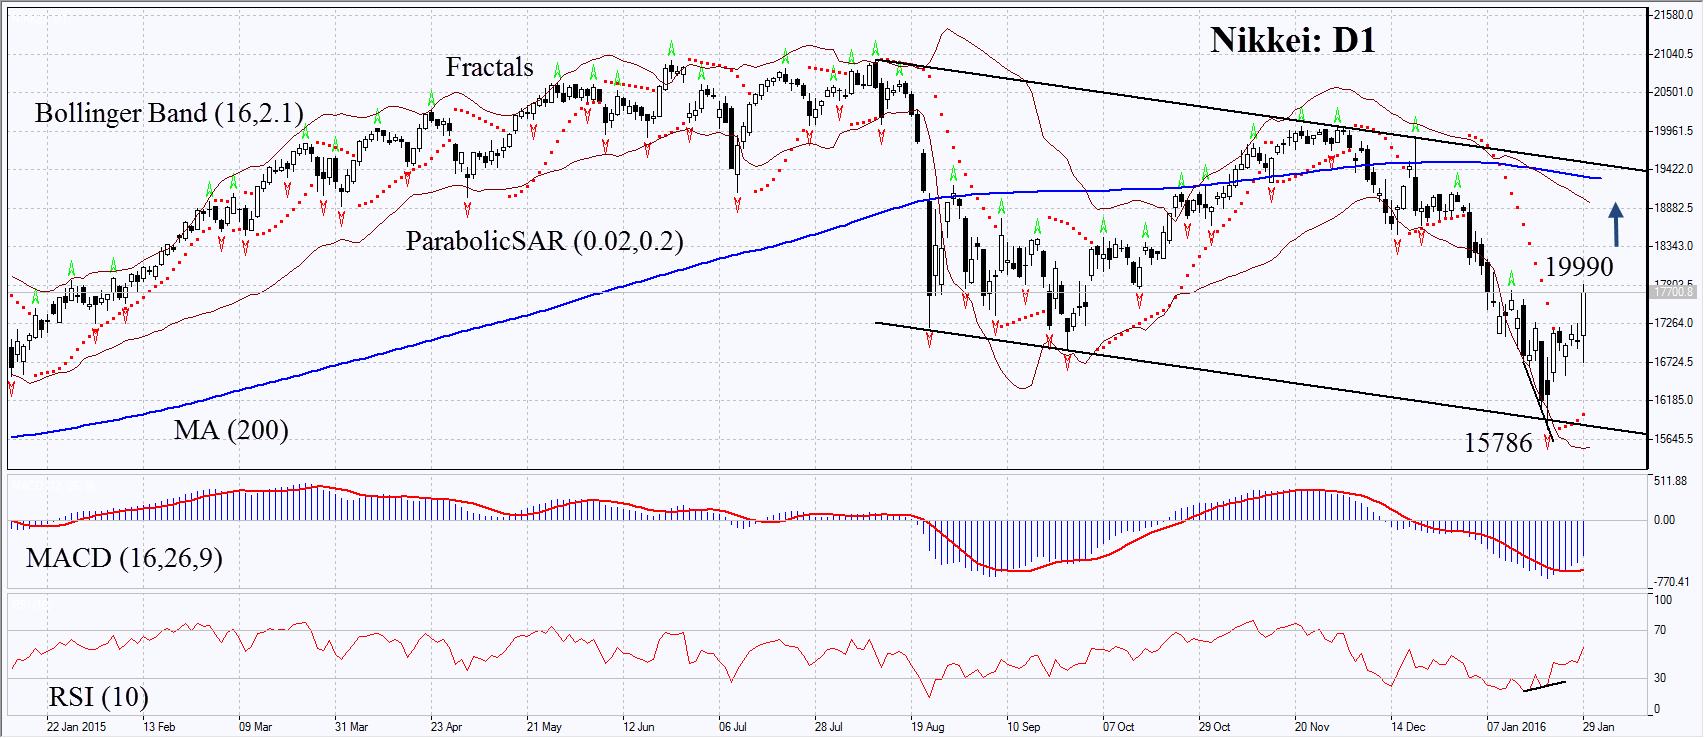
On the daily chart Nikkei: D1 failed to break down through the downtrend support and began correcting upwards. The Parabolic and MACD indicators give buy signals. The RSI has formed the positive divergence and is above 50. It has not yet reached the overbought zone. The Bollinger bands® have widened a lot which means higher volatility. The bullish momentum may develop in case Nikkei surpasses the Friday’s high and the last fractal high at 19990. This level may serve the point of entry. The initial risk-limit may be placed below the Parabolic signal and the last fractal low at 15786. Having opened the pending order we shall move the stop to the next fractal low following the Parabolic and Bollinger signals. Thus, we are changing the probable profit/loss ratio to the breakeven point. The most risk-averse traders may switch to the 4-hour chart after the trade and place there a stop-loss moving it in the direction of the trade. If the price meets the stop-loss level at 15786 without reaching the order at 19990, we recommend cancelling the position: the market sustains internal changes which were not taken into account.
Position Buy Buy stop above 19990 Stop loss below 15786
