Important data will come out on Thursday
In this review, we will consider the dynamics of GBP/NZD currency pair. Its rate may decrease in case of the weakening of the British pound and strengthening of the New Zealand dollar. As it can be seen from the chart, there has been a reverse trend in recent months. Is there a possibility of a reversal down?
On Thursday, the approval of the government budget is expected in New Zealand. Due to an increase in tax revenues, the budget surplus may significantly exceed NZ $473 million expected earlier. In general, the economic indicators of New Zealand look stronger than the British ones. In particular, the GDP growth in Q4 of 2016 was + 2.7% against + 1.9% in the UK.
The rate of the Reserve Bank of New Zealand is + 1.75%. This is much higher than the rate of the Bank of England, which is equal to 0.25%. It is worth mentioning the high volatility of the British pound against the US dollar amid parliamentary elections in Great Britain on June 8, 2017. Theoretically, they can affect Brexit's plans. This Thursday, the data on UK GDP growth for the first quarter of 2017 will come out.

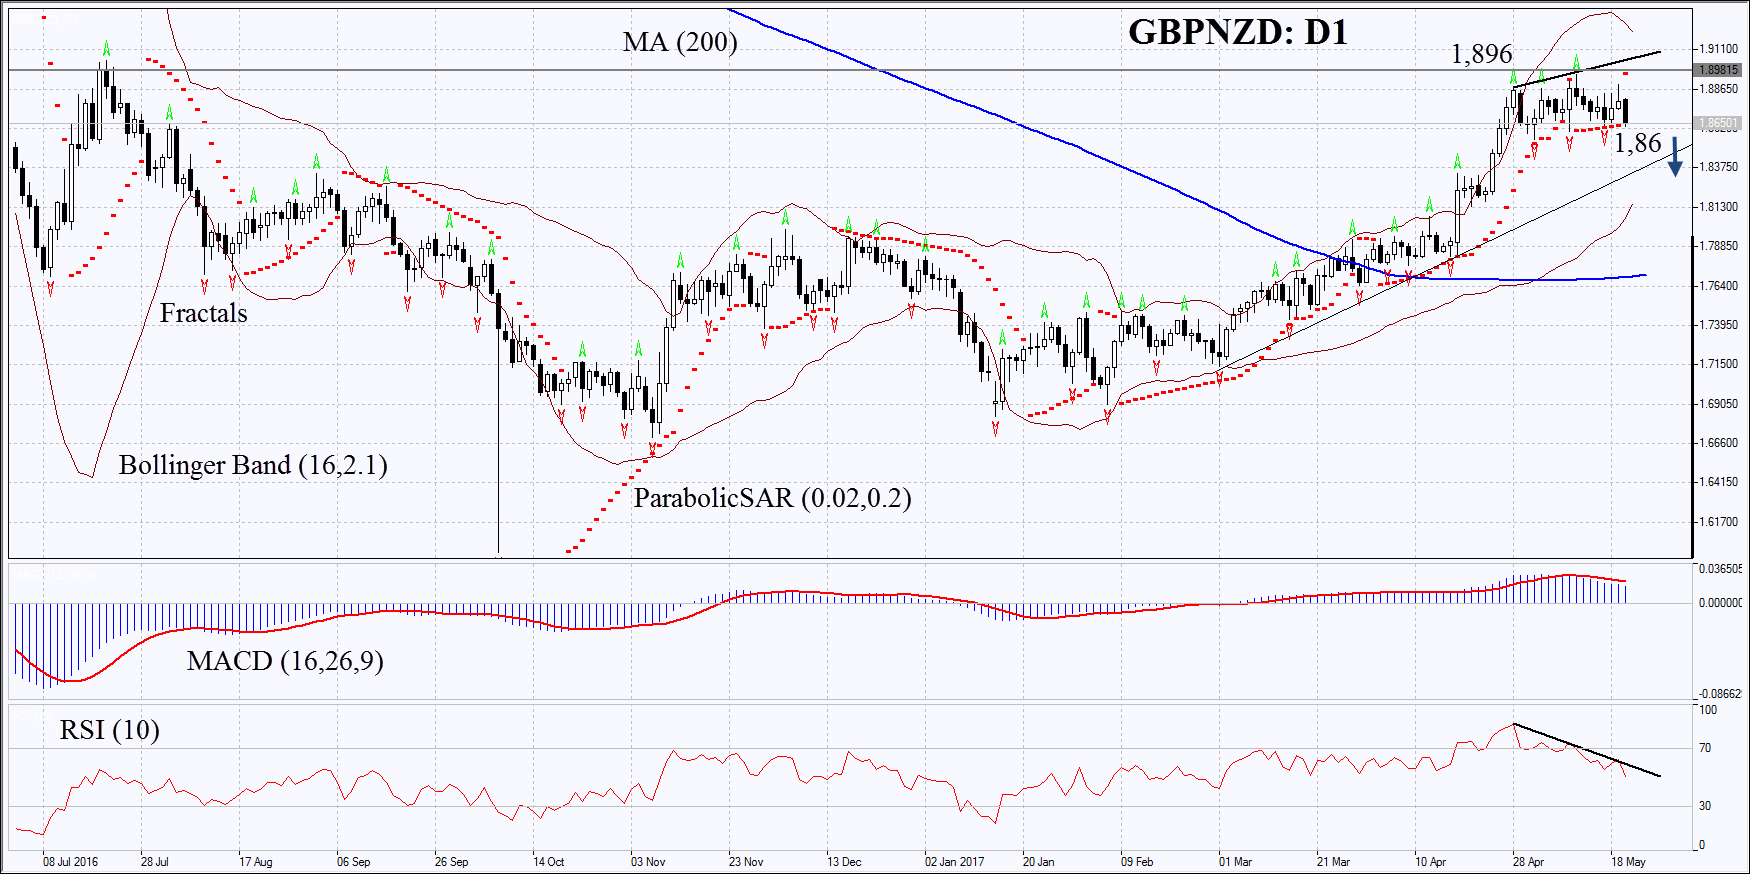
On the daily timeframe, GBP/NZD: D1is in an ascending channel. It could not overcome the 10-month maximum and the resistance line. Now, the rate is trying to correct down. The further decline is possible in case of the publication of weak economic data in the UK or in case of the strengthening of the New Zealand dollar.
- The Parabolic indicator gives a bearish signal.
- The Bollinger bands have widened, which indicates high volatility.
- The RSI indicator is slightly above 50. It has formed a negative divergence.
- The MACD indicator is giving bearish signals.
The bearish momentum may develop in case GBP/NZD falls below the two last fractal lows at 1,86. This level may serve as an entry point. The initial stop-loss may be placed above the last fractal high, the 10-month high and the Parabolic signal at 1,896. After opening the pending order, we shall move the stop to the next fractal high following the Bollinger and Parabolic signals. Thus, we are changing the potential profit/loss to the breakeven point.
More risk-averse traders may switch to the 4-hour chart after the trade and place there a stop-loss moving it in the direction of the trade. If the price meets the stop level at 1,896 without reaching the order at 1,86, we recommend cancelling the position: the market sustains internal changes that were not taken into account.
Summary of technical analysis:
Position: Sell
Sell stop: Below 1,86
Stop loss: Above 1,896
Which stock should you buy in your very next trade?
With valuations skyrocketing in 2024, many investors are uneasy putting more money into stocks. Unsure where to invest next? Get access to our proven portfolios and discover high-potential opportunities.
In 2024 alone, ProPicks AI identified 2 stocks that surged over 150%, 4 additional stocks that leaped over 30%, and 3 more that climbed over 25%. That's an impressive track record.
With portfolios tailored for Dow stocks, S&P stocks, Tech stocks, and Mid Cap stocks, you can explore various wealth-building strategies.
