Technology shares have overtaken financial stocks as the top sector performer for the trailing one-year period, based on a set of ETFs. The formerly high-flying financials have been clobbered recently, in part due to worries that falling bond yields and the blowback due to hurricanes striking the US will take a bite out of earnings for banks and insurers. Tech shares, by contrast, have been relatively steady this week, holding on to nearly all of the sector’s 2017 rally.
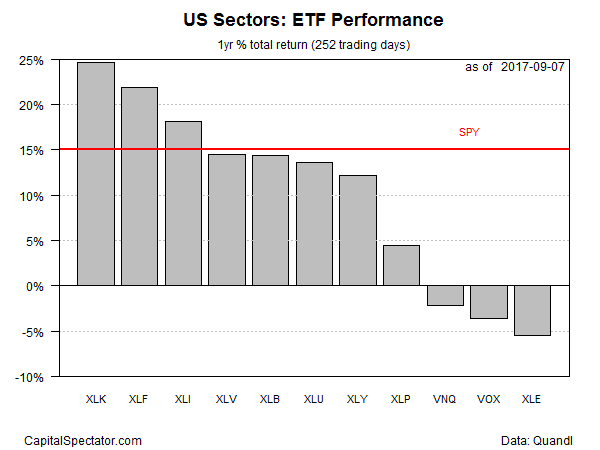
Technology Select Sector SPDR (NYSE:XLK) is the top sector performer, posting a strong 24.7% total return for the past 12 months through yesterday (September 7). That’s a comfortable lead over the number-two performance for the major US-sector landscape via Financial Select Sector SPDR Fund (NYSE:XLF), which is ahead by 22.0% on a trailing one-year basis.
In both cases, the one-year changes remain well above the broad market’s return over the past year, based on the based on SPDR S&P 500 (NYSE:SPY), which is up 15.0% for the past 12 months.
Energy remains the worst-performing sector for one-year results. Despite a sharp rally in recent days, Energy Select Sector SPDR (NYSE:XLE) is down 5.5% vs. the year-earlier level.

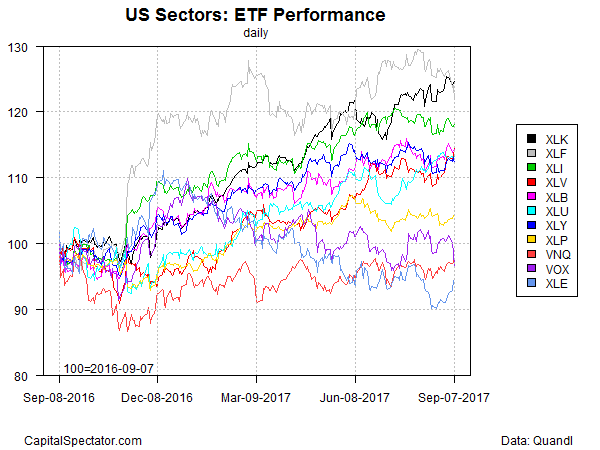
The chart below compares sector performances in relative terms via rebased indexes with a year-ago start date of September 7, 2016. Note the recent reversal for financials (gray line) after an extended period of high-flying results and the relatively steady uptrend for tech (black line).

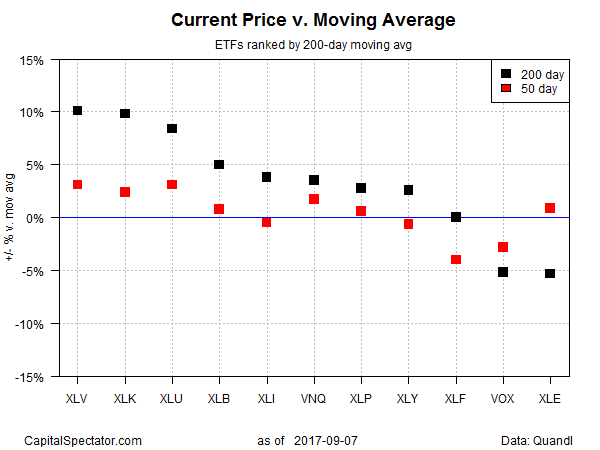
Ranking the sector ETFs by price relative to 200-day moving average shows that healthcare stocks are currently posting the strongest technical profile. The current price premium for Health Care Select Sector SPDR (NYSE:XLV) over its 200-day average is 10.1%, just slightly ahead of tech’s 9.8% (XLK).

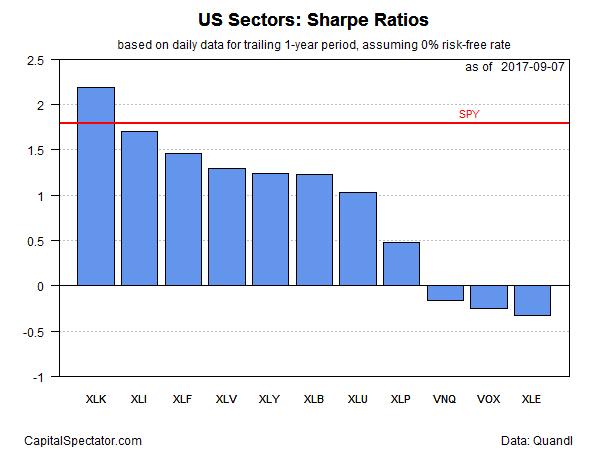
Looking at one-sector performances through the lens of risk-adjusted returns, based on trailing one-year Sharpe ratio (SR), shows that tech is firmly in the lead. Higher Sharpe ratios indicate stronger risk-adjusted performance. By this measure, XLK’s 2.2 SR leads the field over the past 12 months. Meanwhile, the broad market (SPY) is in second place, posting a 1.8 SR — above all the sector SRs except for tech.

