🍎 🍕 Less apples, more pizza 🤔 Have you seen Buffett’s portfolio recently?Explore for Free

Tech Stocks Buoyant After Apple Earnings: Market Update

Published 08/02/2017, 07:15 AM
Updated 02/02/2022, 05:40 AM
EUR/USD
-
USD/JPY
-
NZD/USD
-
US500
-
CL
-

Main Market Movers

The equity rally continues as the S&P 500 companies furiously beat expectations. August got off to a robust start for European equities, supported further by a flurry of positive economic data from the region. The euro’s strength could cause a negative tailwind on corporate earnings as foreign lands struggle to maintain imports at increasingly expensive costs.

Thus far, the euro’s strength has not been European stock’s achille’s heel – with 60% of earnings per share beating forecasts.

Apple’s earnings report gave the technology sector a boost. By comfortably beating analyst’s expectations, the stock rose about 5% in after hour trading.

Forex

EUR

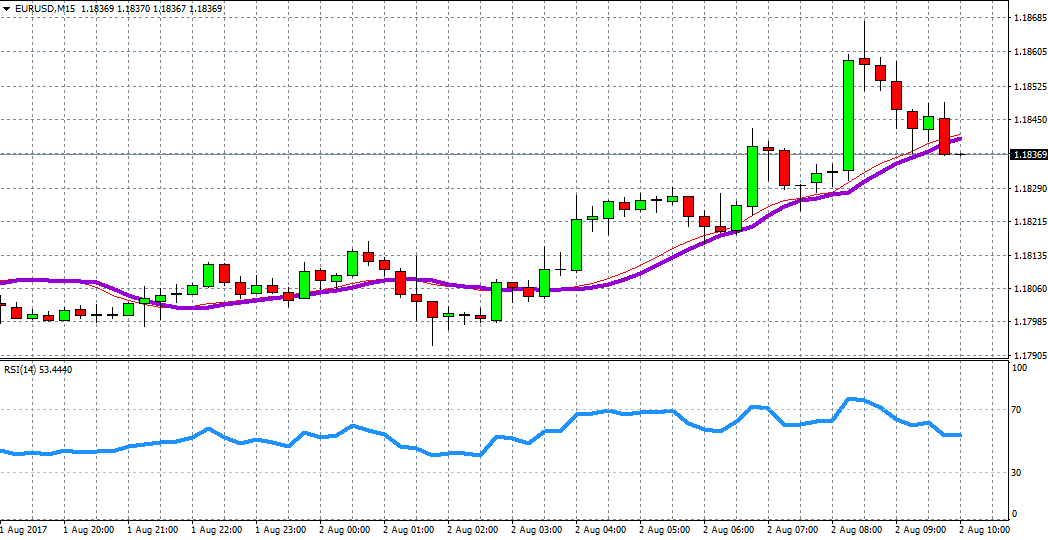
On Tuesday, the euro reached a two-and-a-half year high against its US counterpart. The single currency is set to have its best year since 2003, when it closed the year 12% higher.

USD

Meanwhile, the dollar continues to falter, sliding 0.13% against a basket of currencies. The dollar has been weighed down by Donald Trump’s antics in the White House as investors fear the US president won’t deliver on the fiscal stimulus promised throughout the campaign trail.

EURUSD

An upward sloping moving averages curve signals that more bullish bets are to come.

EUR/USD Chart

NZD

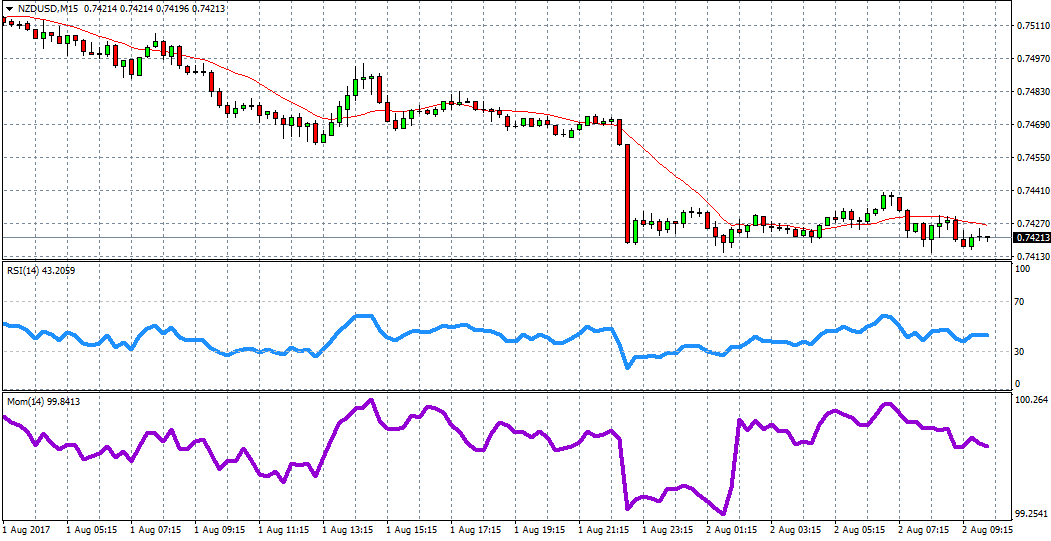
New Zealand’s dollar dropped as much as 0.7% against its US counterpart following weak employment data. Employment change was set to come in at 0.7%, instead the reading was a disappointing -0.2%.

NZDUSD

Momentum is dipping lower which could indicate some bearish movements.

NZD/USD Chart

JPY

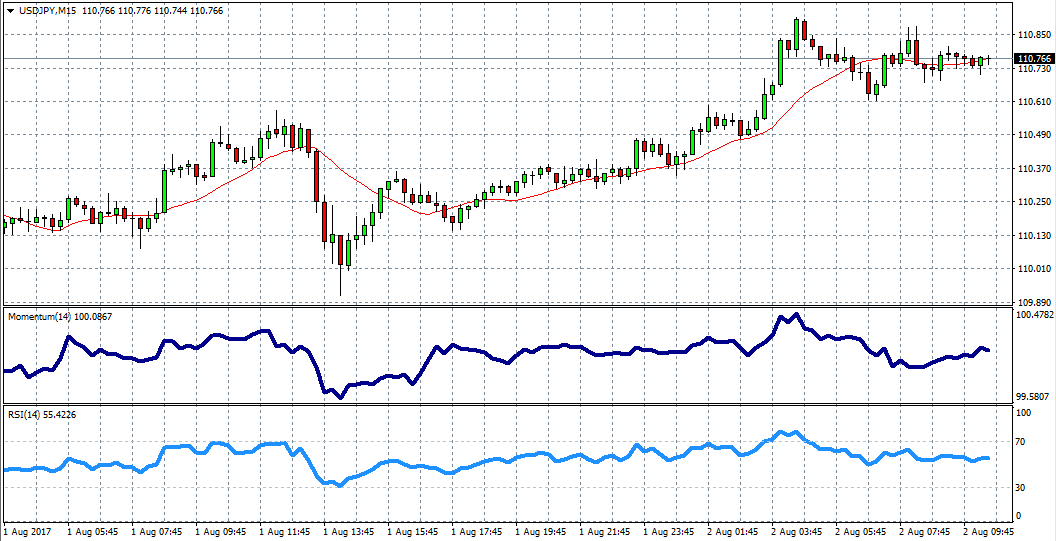
The Japanese yen fell 0.3%, as investors shy away from safe-haven assets, while plunging bullish bets into equity markets.

USDJPY

Momentum is dipping downwards, hinting at possible bearish tones today.

USDJPY Chart

Commodities

Oil prices pushed lower over night as oversupply concerns mounted. Crude oil is now trading below $50.

Crude Oil

The moving averages curve is tipping upwards while the RSI curve is touching 70, for now, crude remains bullish. Today’s crude inventory release will give oil a fresh direction.

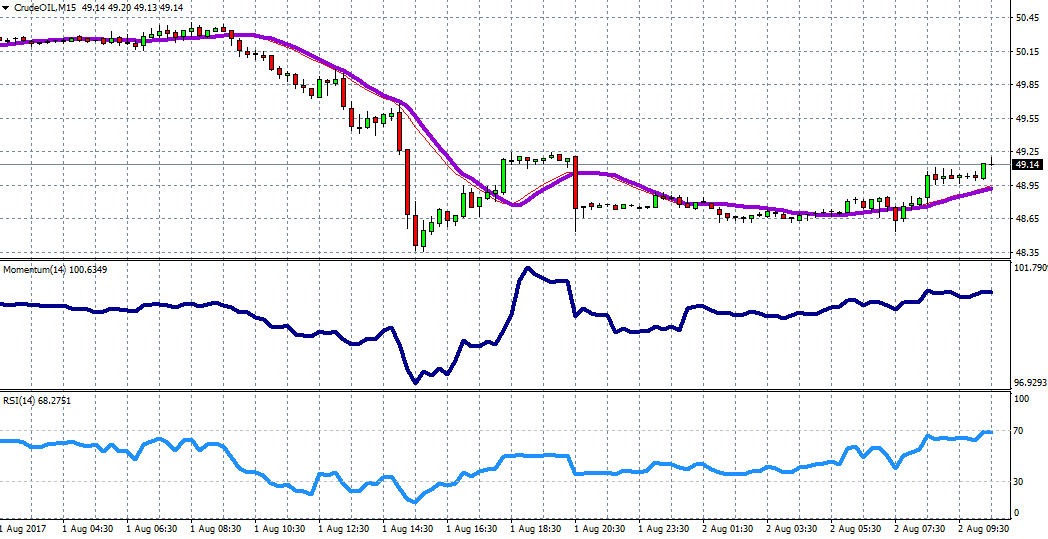
Crude Oil Chart

Latest comments

Loading next article…
Risk Disclosure: Trading in financial instruments and/or cryptocurrencies involves high risks including the risk of losing some, or all, of your investment amount, and may not be suitable for all investors. Prices of cryptocurrencies are extremely volatile and may be affected by external factors such as financial, regulatory or political events. Trading on margin increases the financial risks.
Before deciding to trade in financial instrument or cryptocurrencies you should be fully informed of the risks and costs associated with trading the financial markets, carefully consider your investment objectives, level of experience, and risk appetite, and seek professional advice where needed.
Fusion Media would like to remind you that the data contained in this website is not necessarily real-time nor accurate. The data and prices on the website are not necessarily provided by any market or exchange, but may be provided by market makers, and so prices may not be accurate and may differ from the actual price at any given market, meaning prices are indicative and not appropriate for trading purposes. Fusion Media and any provider of the data contained in this website will not accept liability for any loss or damage as a result of your trading, or your reliance on the information contained within this website.
It is prohibited to use, store, reproduce, display, modify, transmit or distribute the data contained in this website without the explicit prior written permission of Fusion Media and/or the data provider. All intellectual property rights are reserved by the providers and/or the exchange providing the data contained in this website.
Fusion Media may be compensated by the advertisers that appear on the website, based on your interaction with the advertisements or advertisers.
© 2007-2024 - Fusion Media Limited. All Rights Reserved.