Investing.com’s stocks of the week
The surge in market volatility earlier this month took a toll far and wide, but tech’s leadership endures, based on a set of sector ETFs. A fund that holds a diversified mix of technology shares is trading below its recent highs, but the sector has largely bounced back from the early February correction and continues to dominate in the year-over-year column vs. the rest of the field.
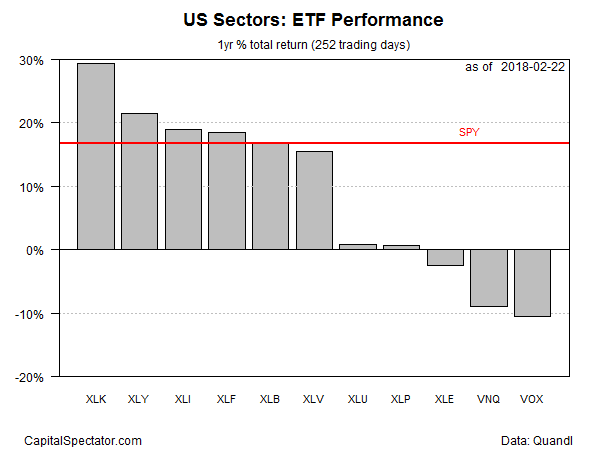
Technology Select Sector SPDR) (XLK) is up 29.3% for the year through yesterday’s close (Feb. 22), a total return that’s comfortably ahead of the second-best performer, (NYSE:Consumer Discretionary Select Sector SPDR) (XLY), which is ahead by 21.5% for the year-over-year comparison.
Meanwhile, weakness in other sectors is spreading in the wake of the market tsunami that struck earlier this month. Measured by the one-year trend, sector momentum is now conspicuously split between winners and losers, with telecom stocks posting the biggest loss. Vanguard Telecommunication Services (NYSE:VOX) is off 10.5% for the year through yesterday, the steepest one-year decline for the sector funds.
Despite the recent turbulence, there’s still a tailwind in the broad market. At the closing bell on Thursday the SPDR S&P 500 (NYSE:SPY)) posted a 16.7% total return vs. the year-earlier level, which is still a healthy premium over the market’s long-term performance.

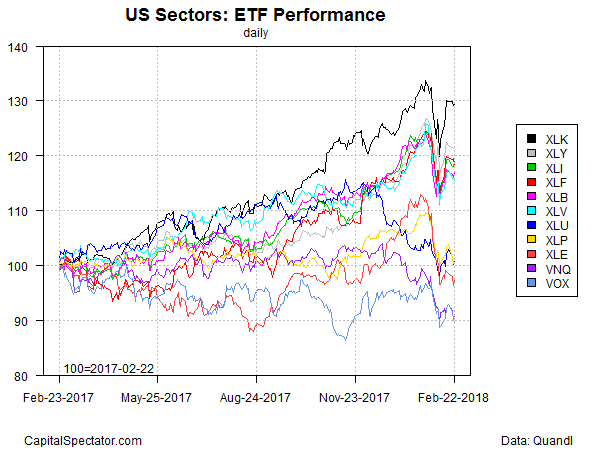
The performance chart below highlights the divided state of trending behavior of late for US sectors. Although seven ETFs bounced back to a degree after the selling wave a few weeks back, five sector ETFs remain in a weakened state and appear to be at risk of sinking further.

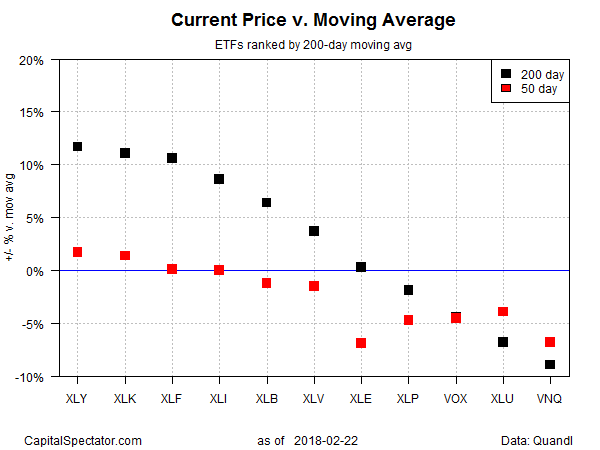
Ranking the sector ETFs by current price relative to 200-day moving average also reflects a soft trending profile for several sectors. Four ETFs are currently trading below their 50- and 200-day averages while only three funds closed above both of those benchmarks yesterday.

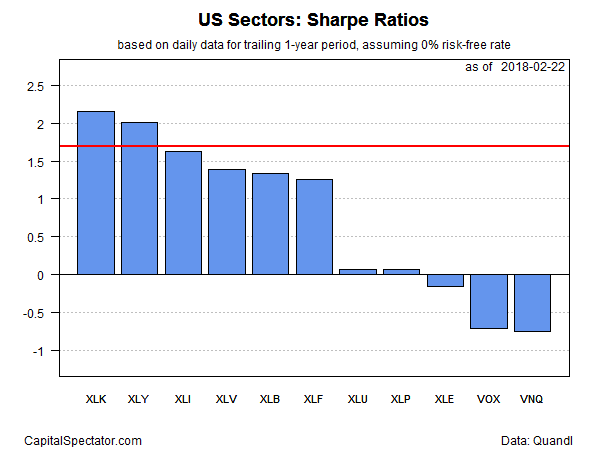
Finally, tech continue to hold the top rank for risk-adjusted performance for the trailing one-year period. XLK’s Sharpe ratio (SR) for the past 12 months has been trimmed in recent weeks, thanks the surge in volatility for stocks generally. But tech is still firmly in the lead with a 2.2 risk-adjusted score, which indicates that XLK’s performance, even after adjusting for volatility, leads the horse race on this front as well.

