Investing.com’s stocks of the week

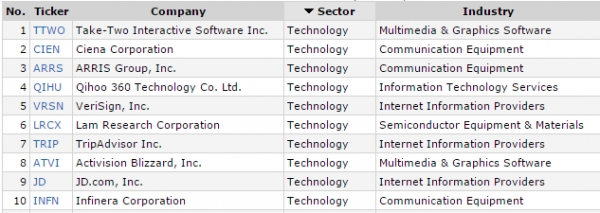
The day starts with 18 stocks on my bullish scan. It incorporates momentum, liquidity, short interest and other technical factors. Toss out one of them as it is involved in a deal. Now 17 stocks. Of those 17 10 are in the technology space. Almost 60%. The tech sector is hot.
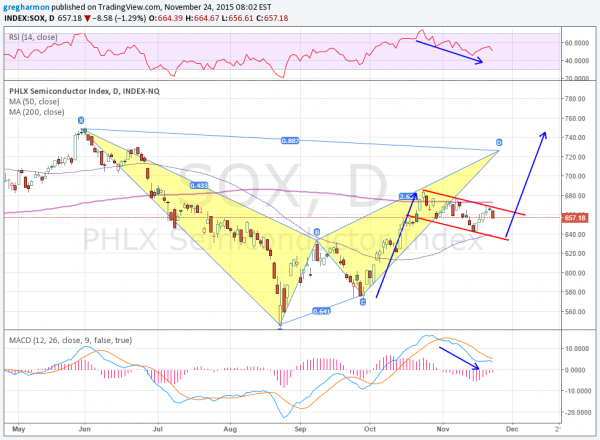
But turning your eyes to the Philadelphia Semiconductor Index you see a different story. It made a lower high in October and has been drifting back lower. It could barely pass over the 200 day SMA but could not hold on. What gives?

The chart above shows two stories. That drift lower could just be the building of a bull flag, but it is getting awkwardly long. If it does break to the upside there remains a bearish Bat harmonic that has a Potential Reversal Zone above at 725. There is also a Measured Move target at 745, right at the prior high from the beginning of June.
But the Index is moving lower towards the bottom of that flag. And the momentum indicators are following to the downside. The RSI is trending lower, although still in the bullish one. The MACD is also trending lower, and is turning lower as well, avoiding what looked to be a bullish cross to the upside.
Time will tell which set of circumstances takes control but there seem to be too many tech stocks with good looking technicals for the SOX to continue on this path much longer.
The information in this blog post represents my own opinions and does not contain a recommendation for any particular security or investment. I or my affiliates may hold positions or other interests in securities mentioned in the Blog, please see my Disclaimer page for my full disclaimer.
