It has been fascinating to see the extent to which the 5 largest Tech stocks – Amazon AMZN, Alphabet (NASDAQ:GOOGL) GOOGL, Apple AAPL, Facebook (NASDAQ:FB) (FB) and Microsoft MSFT – have moved in response to their quarterly releases in recent days. While Alphabet and Amazon literally added hundreds of billions of dollars to their market capitalizations in the following day’s trading session, Facebook lost that much after disappointing investors.
These stocks have practically behaved like coiled springs, with the earnings reports helping release them. You can see this in the chart below that shows the stock market performance over the last 3 months of the Zacks Technology sector (green line), the S&P 500 index (red line), Alphabet (purple line), Amazon (blue line) and Facebook (orange line).
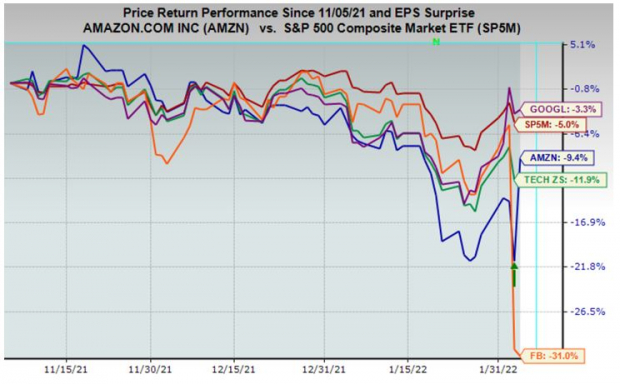 Image Source: Zacks Investment Research
These 5 companies are enormously important to the market as a whole, both in terms of their weight in the indexes as well as their earnings contribution. They combined account for 22.5% of the S&P 500 index’s market capitalization and are contributing 20% of the index’s total 2021 Q4 earnings. For the quarter, these 5 large companies combined earned $98.6 billion in earnings on $408.6 billion in revenues, representing year-over-year growth rates of +26.7% and +15.3%, respectively.
Take a look at the chart below that shows current consensus expectations for this group for the coming periods in the context of what they were able to achieve in 2021 Q4 and the preceding period.
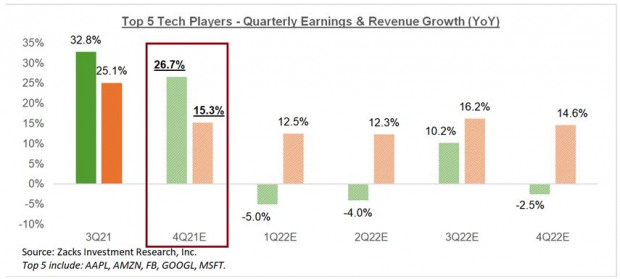 Image Source: Zacks Investment Research
What we see here is that earnings growth is decelerating in a major way, even if we account for some upward revisions estimates in the coming days.
But notice how revenues continue to remain strong; it is the cost pressures that are weighing on earnings expectations. This is actually the big takeaway from the current earnings picture; companies appear to be struggling to meet a historically high-demand environment.
The sources of struggle are logistical bottlenecks that stopped Apple from selling more iPads and Levi’s from selling more jeans as a result of input shortages, logistical bottlenecks and rising costs. All of this is showing up in compressed margins.
Microsoft, Alphabet and Facebook aren’t as vulnerable to logistical bottlenecks as Apple and Amazon are, but they all have to pay up for those brainy engineers.
The chart below that shows the group’s earnings and revenue growth on an annual basis.
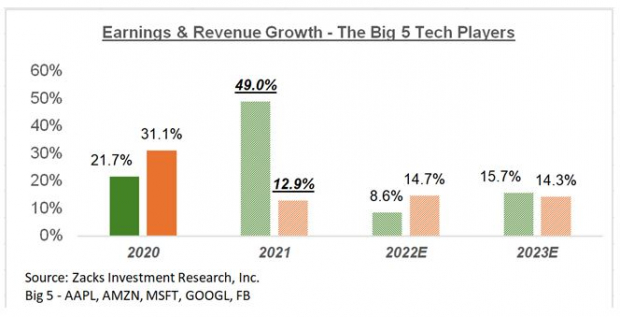 Image Source: Zacks Investment Research
Look at the chart and note the growth trend from 2022 to 2023. In other words, whether the growth trend for these companies is decelerating or not is a function of your holding horizon. These companies are impressive growth engines in the long run.
Beyond the Big 5 Tech players, total Q5 earnings for the Technology sector as a whole are expected to be up +17.9% from the same period last year on +11.3% higher revenues.
The dramatic-looking chart below shows the sector’s Q4 earnings and revenue growth expectations in the context of where growth has been in recent quarters and what is expected in the coming four periods.
Please note that the Q4 earnings and revenue growth rates are the ‘blended’ growth rates, meaning that combines the actual results that have come out already with estimates for the still-to-come companies. The chart would look less dramatic in its decelerating growth trend if we excluded the 2021 Q2 period from it.
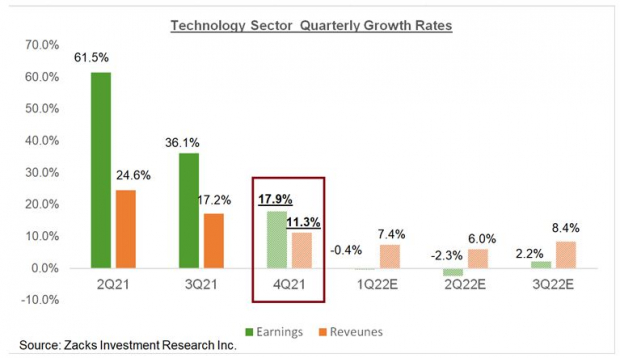 Image Source: Zacks Investment Research
This big picture view of the ‘Big 5’ players as well as the sector as a whole shows a decelerating growth trend.
That said, unlike this ‘quarterly view’, the annual picture shows a lot more stability, as the chart below shows.
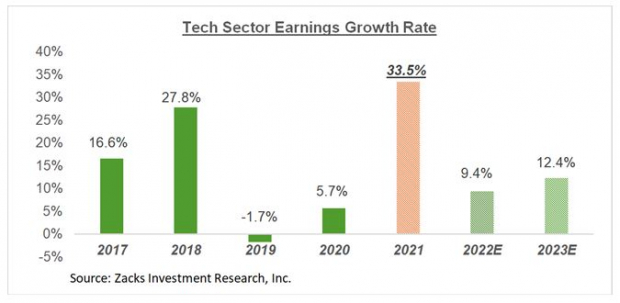 Image Source: Zacks Investment Research
This Week’s Reporting Docket
We have more than 450 companies on deck to report results this week, including 81 S&P 500 members. Notable companies reporting this week include Coke (KO), Pepsi (PEP), Disney (DIS), Pfizer (NYSE:PFE), Twitter (NYSE:TWTR) and others.
Q4 Earnings Season Scorecard
Including all the results that came out through Friday, February 4th, we now have Q4 results from 278 S&P 500 members or 55.6% of the index’s total membership. Total earnings (or aggregate net income) for these 278 companies are up +30.2% from the same period last year on +16% lower revenues, with 78.4% beating EPS estimates and the same proportion beating revenue estimates.
The two sets of comparison charts below put the Q4 results from these 278 index members in a historical context, which should give us a sense how the Q4 earnings season is tracking at this stage relative to other recent periods.
The first set of comparison charts compare the earnings and revenue growth rates for these 278 index members.
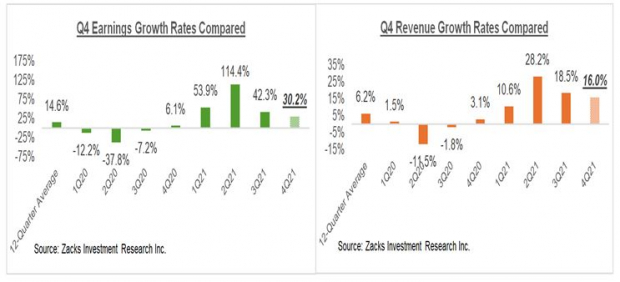 Image Source: Zacks Investment Research
The second set of charts compare the proportion of these 278 index members beating EPS and revenue estimates.
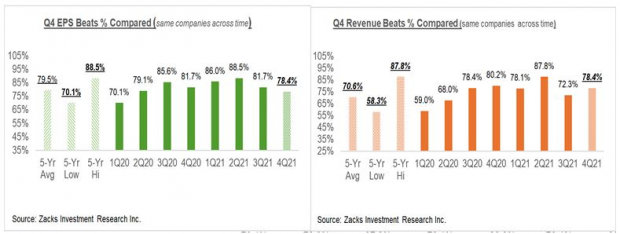 Image Source: Zacks Investment Research
As you can see from the above comparison charts, the Q4 numbers not only represent a growth deceleration from the pace of the first three quarters of the year, but also in terms of the beats percentages, particularly EPS beats percentages.
For the Technology sector, we now have Q4 results from 81.6% of the sector’s market capitalization in the S&P 500 index. Total Q4 earnings for these Tech companies are up +18.6% from the same period last year on +10.7% higher revenues, with 87.8% beating EPS estimates and 82.9% beating revenue estimates.
The comparison charts below put the sector’s Q4 EPS and revenue beats percentages in a historical context.
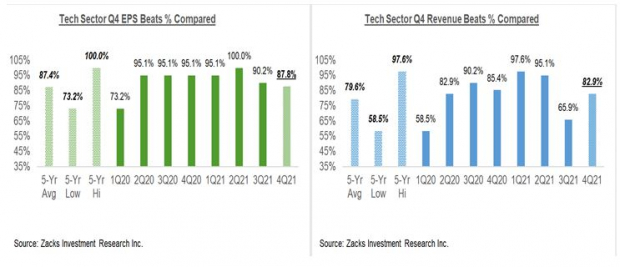 Image Source: Zacks Investment Research
Expectations for Q4 & Beyond
Looking at the quarter as a whole, combining the actual results that have come out with estimates for the still-to-come companies, total Q4 earnings for the S&P 500 index are expected to be up +30.1% from the same period last year on +14.6% higher revenues.
The chart below presents the earnings and revenue growth picture on a quarterly basis, with expectations for 2021 Q4 contrasted with the actual growth achieved over the preceding four quarters and estimates for the following three.
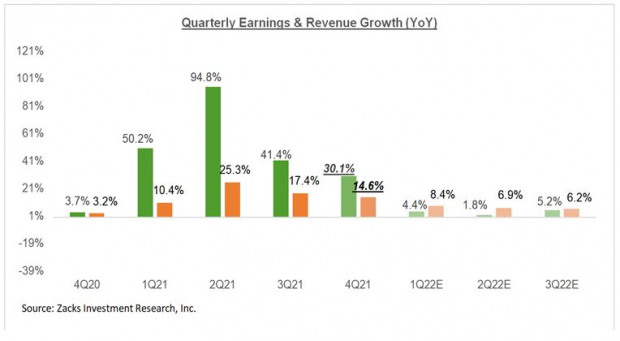 Image Source: Zacks Investment Research
For the current period, total S&P 500 earnings are expected to increase +4.4% from the same period last year on +8.4% higher revenues. The chart below shows the revisions trend for the current period.
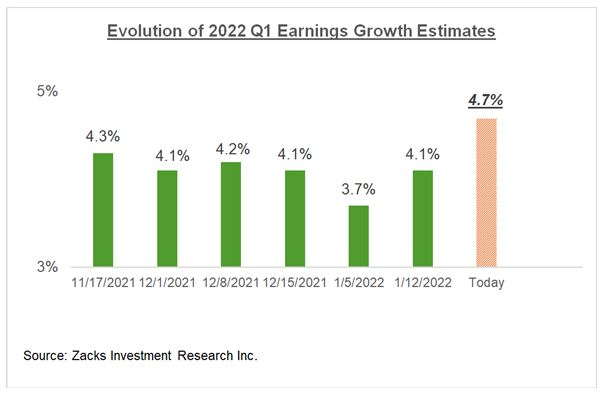 Image Source: Zacks Investment Research
The chart below shows the comparable picture on an annual basis.
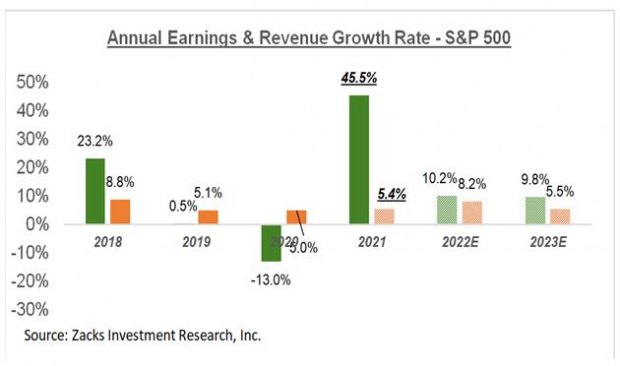 Image Source: Zacks Investment Research
For a detailed look at the overall earnings picture, including expectations for the coming periods, please check out our weekly Earnings Trends report >>>> A Strong and Resilient Earnings Picture Remains Amid Market Volatility
Zacks' Top Picks to Cash in on Artificial Intelligence
In 2021, this world-changing technology is projected to generate $327.5 billion in revenue. Now Shark Tank star and billionaire investor Mark Cuban says AI will create "the world's first trillionaires." Zacks' urgent special report reveals 3 AI picks investors need to know about today.
See 3 Artificial Intelligence Stocks With Extreme Upside Potential>>Want the latest recommendations from Zacks Investment Research? Today, you can download 7 Best Stocks for the Next 30 Days. Click to get this free report
Amazon.com, Inc. (NASDAQ:AMZN): Free Stock Analysis Report
Apple Inc. (NASDAQ:AAPL): Free Stock Analysis Report
Microsoft Corporation (NASDAQ:MSFT): Free Stock Analysis Report
Meta Platforms, Inc. (FB): Free Stock Analysis Report
Alphabet Inc. (GOOGL): Free Stock Analysis Report
To read this article on Zacks.com click here.
Zacks Investment Research
