Tech Bulls Have Not Seen This Pattern Since The 2000 Highs

Published 11/11/2020, 03:38 PM
Updated 07/09/2023, 06:31 AM
NDX
-
US2000
-

It’s always good to monitor the performance of market-leading sectors and indices. These leaders provide insight into the health of the bull market, potential trend changes, and/or the trend status of that particular sector or index.

NASDAQ 100, Russell 2000

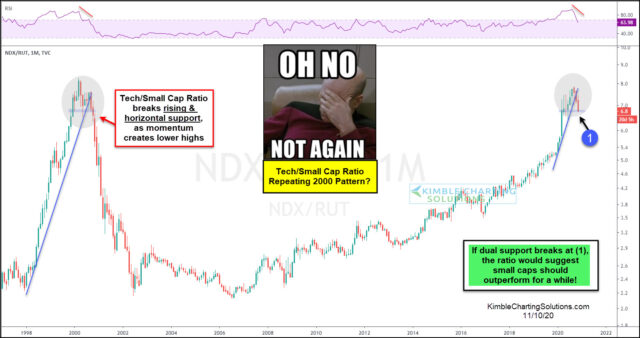
Today’s focus is on a long-term “monthly” chart, highlighting a current bull market leader—The NASDAQ 100 Index (representing large-cap technology stocks). And more specifically, today’s chart compares the performance of the NASDAQ 100 Index to the Russell 2000 Index (representing small-cap stocks).

This ratio clearly displays the importance of large-cap tech stocks to the current bull market. Wow, just look at the out-performance over the past 10+ years!!

BUT, all good things eventually come to an end… and if you have been around the block for a few decades, maybe you are experiencing a little deja vu.

Recently, the large-cap tech to small caps ratio has turned lower (and momentum has turned down as well). This looks awfully familiar to what happened back in 2000. Similarly, the ratio broke its steep up-trend and is now testing a big horizontal support level at (1). Horizontal support broke in 2000, confirming the reversal lower… will it break again in 2020 or early 2021?

Latest comments

Loading next article…
Risk Disclosure: Trading in financial instruments and/or cryptocurrencies involves high risks including the risk of losing some, or all, of your investment amount, and may not be suitable for all investors. Prices of cryptocurrencies are extremely volatile and may be affected by external factors such as financial, regulatory or political events. Trading on margin increases the financial risks.
Before deciding to trade in financial instrument or cryptocurrencies you should be fully informed of the risks and costs associated with trading the financial markets, carefully consider your investment objectives, level of experience, and risk appetite, and seek professional advice where needed.
Fusion Media would like to remind you that the data contained in this website is not necessarily real-time nor accurate. The data and prices on the website are not necessarily provided by any market or exchange, but may be provided by market makers, and so prices may not be accurate and may differ from the actual price at any given market, meaning prices are indicative and not appropriate for trading purposes. Fusion Media and any provider of the data contained in this website will not accept liability for any loss or damage as a result of your trading, or your reliance on the information contained within this website.
It is prohibited to use, store, reproduce, display, modify, transmit or distribute the data contained in this website without the explicit prior written permission of Fusion Media and/or the data provider. All intellectual property rights are reserved by the providers and/or the exchange providing the data contained in this website.
Fusion Media may be compensated by the advertisers that appear on the website, based on your interaction with the advertisements or advertisers.
© 2007-2025 - Fusion Media Limited. All Rights Reserved.