Last week President Trump announced his tax plan, which discussed lowering the corporate tax rate, closing tax loopholes, reducing individual income tax brackets and increasing standard deductions. That table below, via Goldman Sachs (NYSE:GS), shows the comparison between current law and the various proposals.
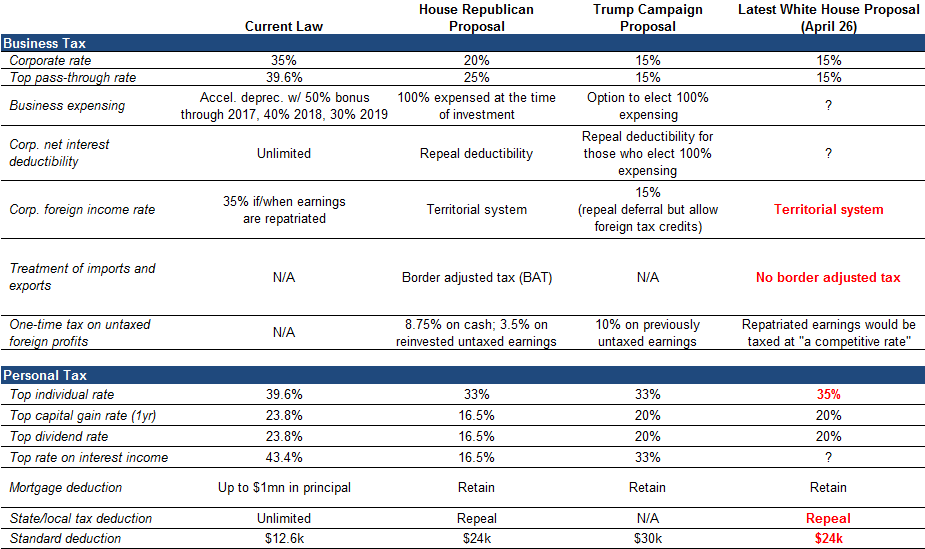
President Trump campaigned on lowering taxes as a means by which economic growth could be jump started, and with Q1’s economic growth coming in at a meager 0.7% annualized, it would certainly seem to be needed.
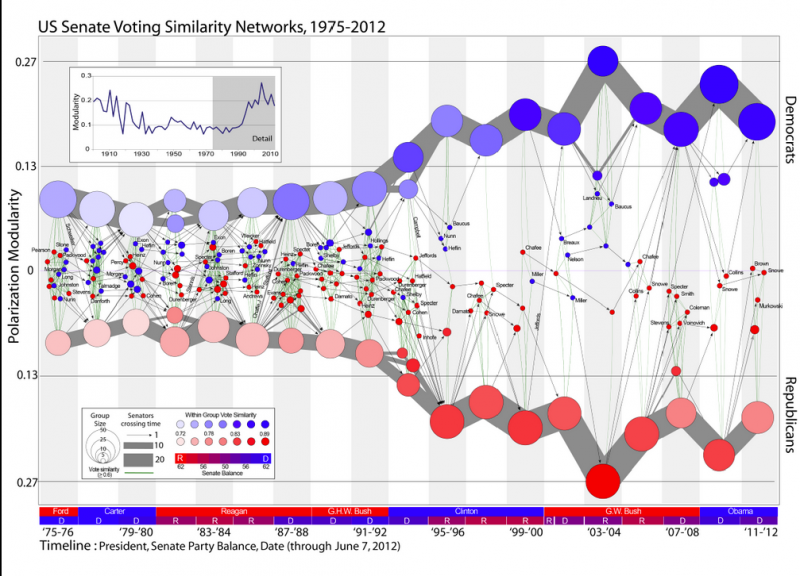
The issue of tax reform is not going to be an easy one. With such a deeply partisan government the probability of passing tax reform as currently proposed is extremely slim. Furthermore, while I do expect that some version of tax reform will eventually get passed, it will likely take much longer than most expect. The chart below shows the current chasm leading to the difficulty of getting anything accomplished in Washington.
But the question I want to address today is simply this:
Do tax reductions lead to higher economic growth, employment and incomes over the long-term as promised?
This is after all what is being promised. On Sunday morning, speaking to NBC’s Meet the Press, VP Mike Pence confirmed just that as he was confident that eventually, the deficit would decline as it would be overcome by economic “growth” thanks to the tax cuts it will fund.
Simple. Right?
Maybe not. The reason is that a tax-rate reduction is quickly absorbed into the economy. Let’s look at the following simple example:
- Year 1: GDP = $1 Trillion
- Taxes Are Reduced Which Puts $100 Billion Into The Economy.
- Year 2: GDP = $1 Trillion + $100 Billion = $1.1 Trillion or 10% GDP Growth
- Going Into Year-3 There Are No New Tax Cuts And All Spending From Previous Year Remains
- Year 3: GDP = $1.1 Trillion + $0 = $1.1 Trillion or 0% GDP Growth
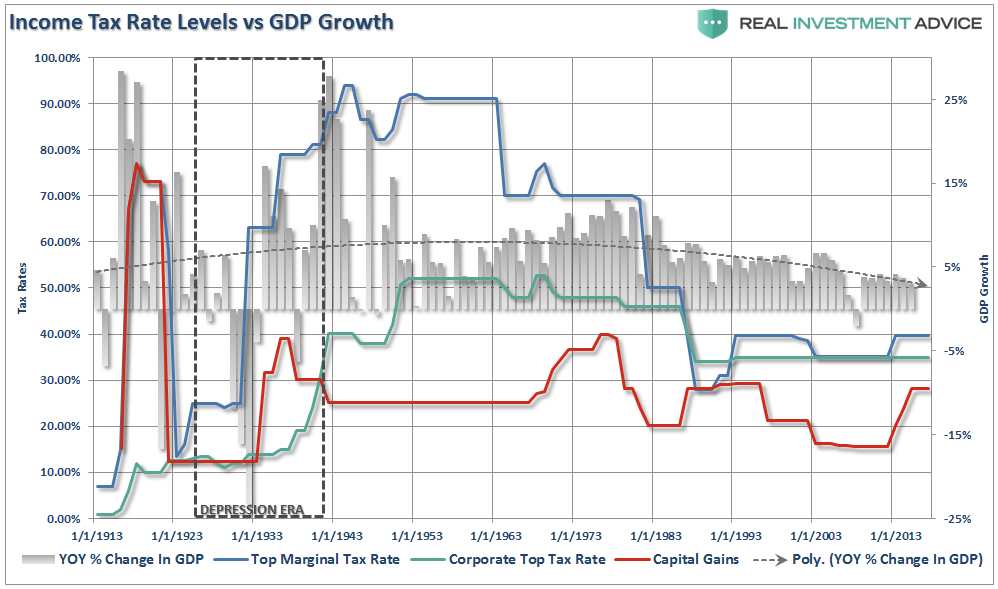
As shown in the chart below, changes to tax rates have a very limited impact on economic growth over the longer term.
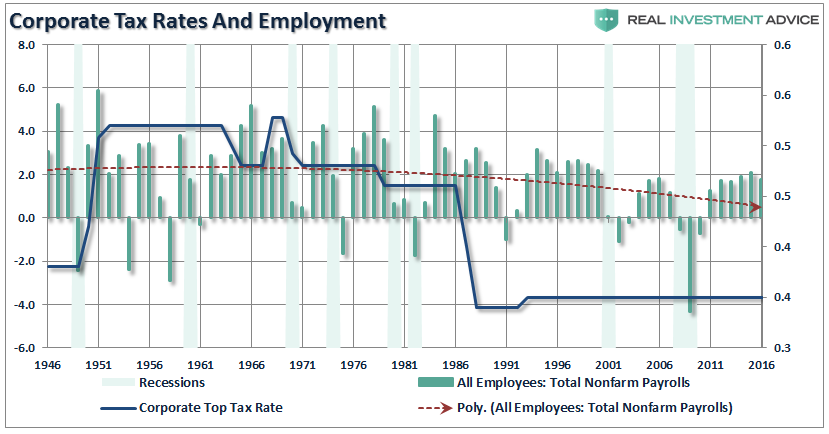
Furthermore, it is believed that tax cuts will lead to a boom in employment. The chart below shows the corporate tax rate versus employment back to 1946. Corporate tax levels create employment change at the margin. If you look at the chart you will notice that when corporate tax rates are reduced employment did marginally increase but only for a short period of time.
What drives employment is sustainable economic growth that leads to higher wages, increased aggregate demand and higher rates of production. In other words, employment adjusts over time to respond to the strength and direction of the economy rather than the movements in tax rates. The chart below shows economic growth versus employment.
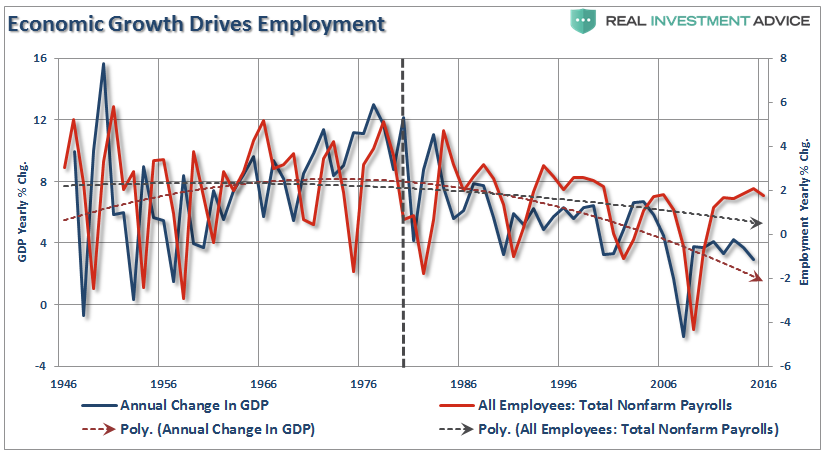
Do not misunderstand me. Tax rates CAN make a difference in the short run particularly when coming out of a recession as it frees up capital for productive investment at a time when recovering economic growth and pent-up demand require it.
However, in the long run, it is the direction and trend of economic growth that drives employment. The reason I say “direction and trend” is because, as you will see by the vertical blue dashed line, beginning in 1980, both the direction and trend of economic growth in the United States changed for the worse.
Furthermore, as I noted previously, Reagan’s tax cuts were timely due to the economic, fiscal, and valuation backdrop which is diametrically opposed to the situation today.
Importantly, as has been stated, the proposed tax cut by President-elect Trump will be the largest since Ronald Reagan. However, in order to make valid assumptions on the potential impact of the tax cut on the economy, earnings and the markets, we need to review the differences between the Reagan and Trump eras. My colleague, Michael Lebowitz, recently penned the following on this exact issue.
‘Many investors are suddenly comparing Trump’s economic policy proposals to those of Ronald Reagan. For those that deem that bullish, we remind you that the economic environment and potential growth of 1982 was vastly different than it is today. Consider the following table:'
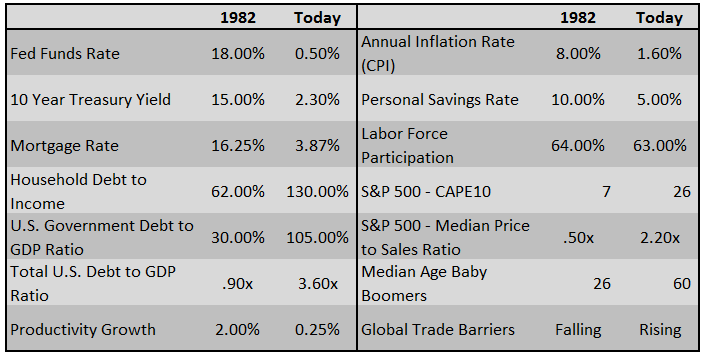
The differences between today’s economic and market environment could not be starker. The tailwinds provided by initial deregulation, consumer leveraging and declining interest rates and inflation provided huge tailwinds for corporate profitability growth. The chart below shows the ramp up in government debt since Reagan versus subsequent economic growth and tax rates.
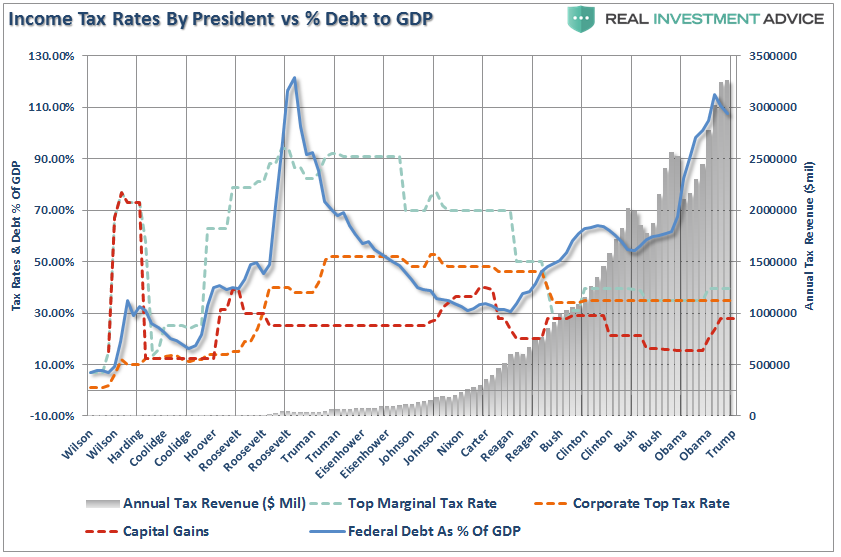
(Important Note: The slight downtick in the Debt/GDP ratio is ONLY DUE to the debt ceiling being frozen currently at $20 Trillion. With the passage of a continuing resolution, new debt issuance will surge pushing the current ratio to new highs.)
Of course, as noted, rising debt levels is the real impediment to longer-term increases in economic growth. When 75% of your current Federal Budget goes to entitlements and debt service, there is little left over for the expansion of the economic growth.
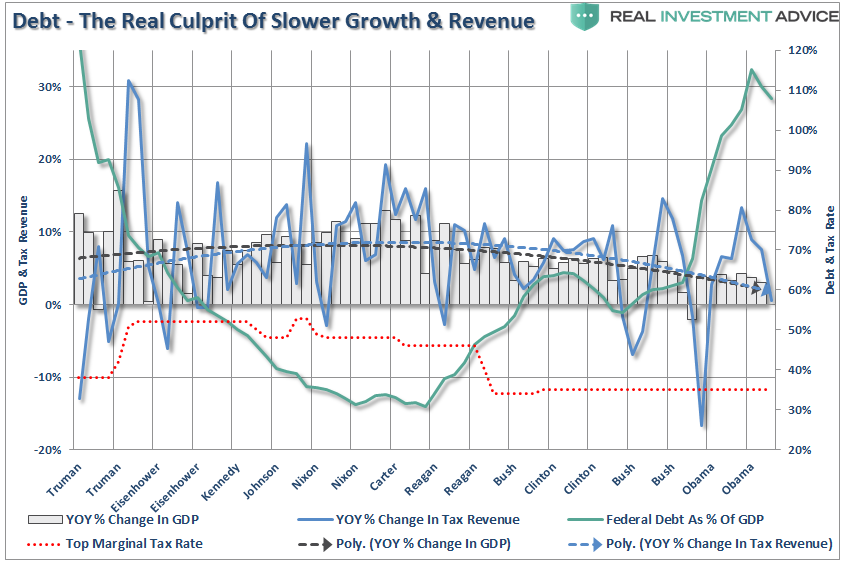
The tailwinds enjoyed by Reagan are now headwinds for Trump.
But it isn’t just the Government that has lost its way in terms of “fiscal responsibility.” As the next chart shows, as economic output declined – consumers also turned to debt to sustain their standard of living which reduced personal savings and productive investment. The Austrian Business Cycle Theory predicted that the current economic malaise would be caused by:
…the inevitable consequence of excessive growth in bank credit, exacerbated by inherently damaging and ineffective central bank policies, which cause interest rates to remain too low for too long, resulting in excessive credit creation, speculative economic bubbles and lowered savings.
In other words, the proponents of Austrian economics believe that a sustained period of low interest rates and excessive credit creation results in a volatile and unstable imbalance between saving and investment. Low interest rates tend to stimulate borrowing from the banking system which in turn leads, as one would expect, to the expansion of credit. This expansion of credit then, in turn, creates an expansion of the supply of money and, therefore, the credit-sourced boom becomes unsustainable as artificially stimulated borrowing seeks out diminishing investment opportunities. Finally, the credit-sourced boom results in widespread malinvestments.
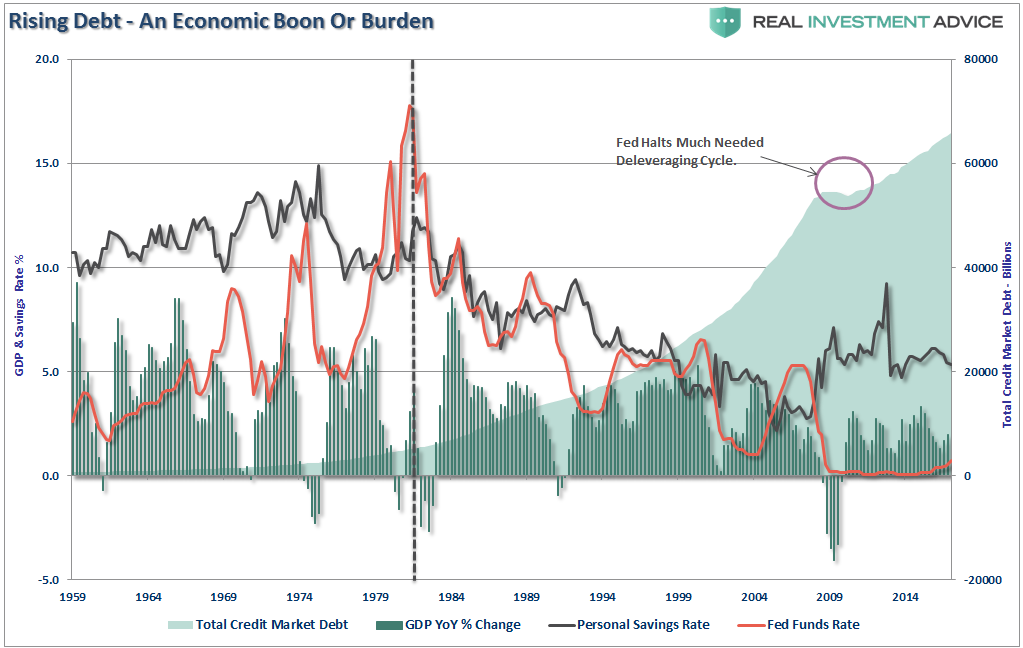
Does any of this sound familiar?
As I discussed this past weekend, the rise in delinquency rates may be a warning sign that debt-driven malinvestments have likely come home to roost.
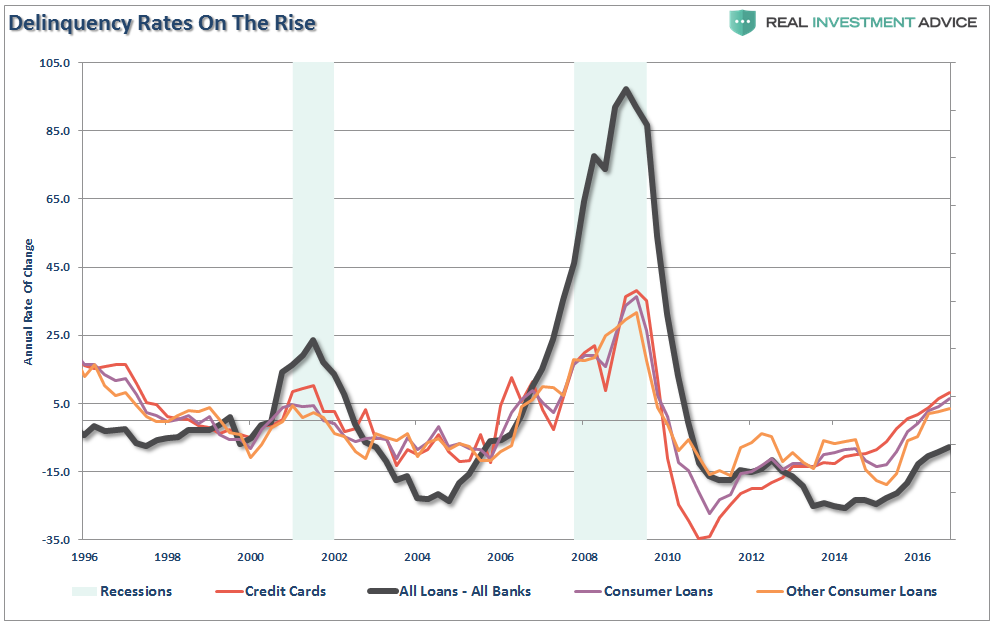
This is why the economic “boom” of the 80’s and 90’s was really not much more than a debt-driven illusion that has now come home to roost.
Tax Cuts Don’t Reduce The Deficit
So, back to Vice-President Pence’s belief that tax cuts will eventually become revenue neutral due to expanded economic growth, Peter Baker via the NYT recently made the same point:
While a corporate tax rate cut of the dimension Mr. Trump envisions would reduce tax revenues by more than $2 trillion over the next 10 years, Mr. Mnuchin noted that an increase in economic growth of a little more than one percentage point would generate close to the same amount. The goal, he said, was to produce a sustained national growth rate of 3 percent, instead of the 1.8 percent now projected over the next decade.
The problem with the claims is there is NO evidence that is the case. The increases in deficit spending to supplant weaker economic growth has been apparent with larger deficits leading to further weakness in economic growth. In fact, ever since Reagan first lowered taxes in the ’80’s both GDP growth and the deficit have only headed in one direction – lower.
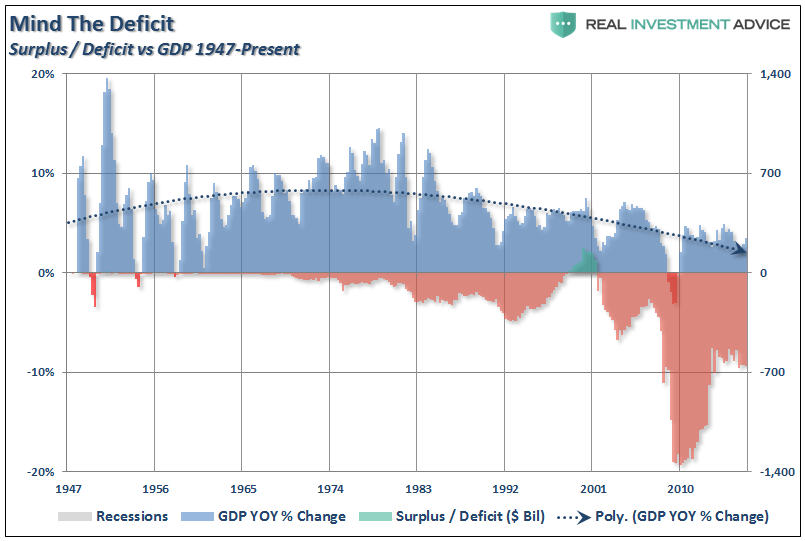
As noted above, there are massive differences between the economic and debt related backdrops between the early 80’s and today.
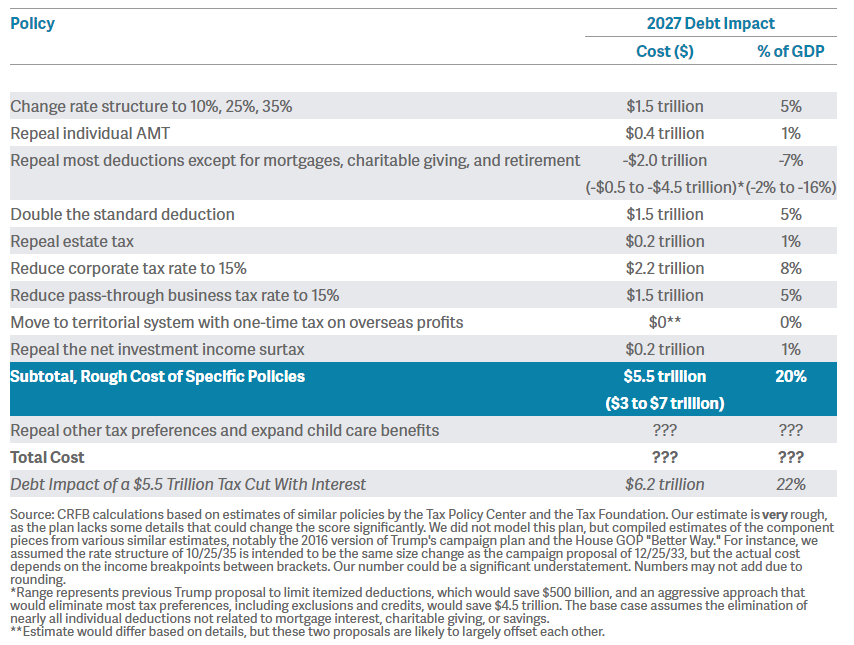
The Committee For A Responsible Federal Budget just recently analyzed Trump’s proposed tax plan and came away with the following analysis:
The White House released principles and a framework for tax reform today. We applaud the President’s focus on tax reform, but the plan includes far more detail on how the Administration would cut taxes than on how they would pay for those cuts. Based on what we know so far, the plan could cost $3 to $7 trillion over a decade– our base-case estimate is $5.5 trillion in revenue loss over a decade. Without adequate offsets, tax reform could drive up the federal debt, harming economic growth instead of boosting it.
The true burden on taxpayers is government spending, because the debt requires future interest payments out of future taxes. As debt levels, and subsequently deficits, increase, economic growth is burdened by the diversion of revenue from productive investments into debt service.
This is the same problem that many households in America face today. Many families are struggling to meet the service requirements of the debt they have accumulated over the last couple of decades with the income that is available to them. They can only increase that income marginally by taking on second jobs. However, the biggest ability to service the debt at home is to reduce spending in other areas.
While lowering corporate tax rates will certainly help businesses potentially increase their bottom line earnings, there is a high probability that it will not “trickle down” to middle-class America.
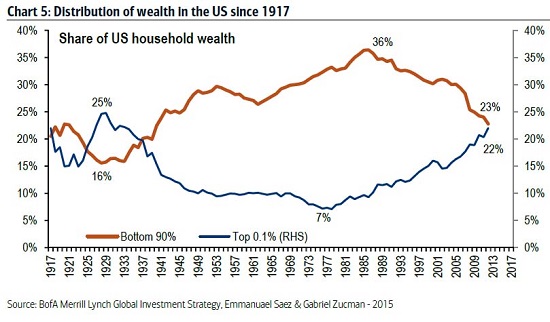
While I am certainly hopeful for meaningful changes in tax reform, deregulation and a move back towards a middle-right political agenda, from an investment standpoint there are many economic challenges that are not policy driven.
- Demographics
- Structural employment shifts
- Technological innovations
- Globalization
- Financialization
- Global debt
These challenges will continue to weigh on economic growth, wages and standards of living into the foreseeable future. As a result, incremental tax and policy changes will have a more muted effect on the economy as well.
As Mike concluded in his missive:
As investors, we must understand the popular narrative and respect it as it is a formidable short-term force driving the market. That said, we also must understand whether there is logic and truth behind the narrative. In the late 1990’s, investors bought into the new economy narrative. By 2002, the market reminded them that the narrative was born of greed not reality. Similarly, in the early to mid-2000’s real estate investors were lead to believe that real-estate prices never decline.
The bottom line is that one should respect the narrative and its ability to propel the market higher.
Will “Trumponomics” change the course of the U.S. economy? I certainly hope so. Unfortunately, there is no evidence that such has ever been the case.
As investors, we must understand the difference between a “narrative-driven” advance and one driven by strengthening fundamentals. The first is short-term and leads to bad outcomes. The other isn’t, and doesn’t.
