We wake up to a pullback in the US Futures market and the new robots attribute it to talk of tariffs moving forward with China. That might be or it might be that the S&P 500 options contract that expires at the open Friday morning has its highest open interest by far at the 2775 strike and it closed at 2782. Either way that is a short term view and noise can cloud the picture and distort what you see.
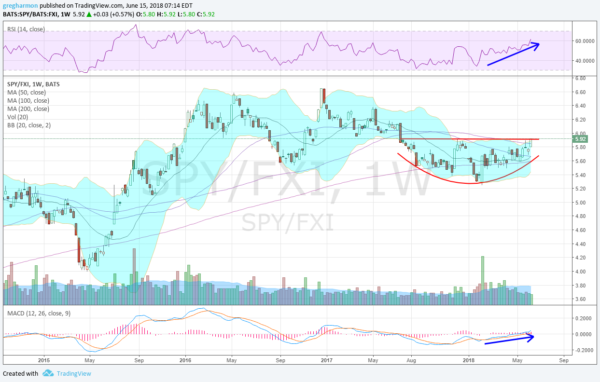
It is the longer view that guides the trend and cuts through that noise. In regards to the US and China one perspective is to look at the respective stock markets. We can do this with a ratio chart. The chart below compares the S&P 500 ETF ($SPY) to the Chinese Large Cap ETF ($FXI) on a weekly basis. The first thing to note was the great strength of the S&P 500 relative to the Chinese market in 2015. Here the ratio rose rapidly, gaining over 65%. But it consolidated after that, moving sideways mainly in a range.
When we look a bit closer we see a higher peak at the end of 2016 and then a pullback that continued throughout 2017, Chinese market strength relative to the US market. That pullback met the 200 day SMA and found support. Turning into 2018 it started to move back higher, creating a rounding bottom. And this week it looks to close at a new 11 month high. This turn around it building to a possible break out of the US market measured against the Chinese market.
Momentum has been supportive of this reversal high as well. The RSI is trending higher and into the bullish zone. The MACD is also trending up and now positive. A push to 5.95 in the ratio would give a strong confirmation of a reversal to play out to the upside.
The information in this blog post represents my own opinions and does not contain a recommendation for any particular security or investment. I or my affiliates may hold positions or other interests in securities mentioned in the Blog, please see my Disclaimer page for my full disclaimer.

