By definition, a recovery is the regaining of something lost. Homeowners have partially (and in some instances, entirely) recovered the equity in their property since the start of the Great Recession. Similarly, market-based securities investors have regained their capital and even accumulated additional paper wealth.
The jobs recovery is a bit more challenging to quantify. For example, prior to the start of the Great Recession in December of 2007, the headline unemployment rate was 4.7%. A year into the economic contraction, unemployment rocketed to 9.7%. Today, then, a headline unemployment rate of 5.6% checks in as a promising turnaround.
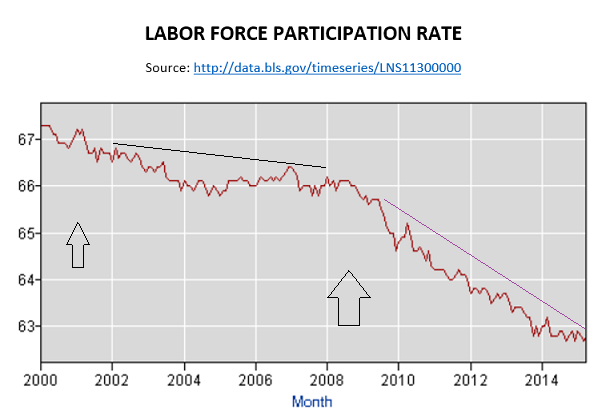
On the flip side, today’s unemployment rate fails to reflect employment conditions accurately. Why? Primarily, the United States has witnessed an epic exodus of working-aged individuals from the labor force since the end of the recession (5/09); the number of new jobs created in these six years merely offsets the number that dissipated. In sum, when a particular economist chooses to factor in the labor force participation percentage, he/she would describe today’s conditions as representative of 9.6% unemployment. That’s not much better than where we were in December of 2008.

What is particularly troubling about the data is what federal, state and local governments have had to spend, as well as what the Federal Reserve System has had to do, just to create a positive image of our economic circumstances. Consider the year 2000. The median family had an income of roughly $42,000 and governments spent close to $30,000 per household. As high as that government outlay seems to some observers, myself included, median household income outpaced spending by 40 percent.
Fast forward to the year 2010. Federal, state and local government spending per family unit reached above $49,500, or $19,500 more per family. The growth in spending? Nearly 65% over 10 years! What about the growth in median household income? It rose to roughly $49,275 for a 17% approximate gain that, when adjusted for inflation, reflects no wage growth whatsoever. That’s correct. The overwhelming majority of families did not make any progress in their purchasing power at all.
It gets worse. Although the precise figures for 2014 or 2015 may not be readily available, inflation-adjusted family income is flat in the last four years as well. Yet the spending by governments at all levels continued to ascend into the stratosphere and the Fed effectively spent an additional $3.75 trillion in electronic dollar credits. In sum, the federal, state and local authorities have spent astronomical amounts, the Fed spent extraordinary levels of electronic dollars and the majority of people are, at best, treading water. Recovery? Yes. Progress? I don’t see it.
Why does this matter to investors in market-based securities if 401ks, IRAs, trusts and taxable accounts keep registering record heights? The pressure on governments to rein in spending coupled with the stress on Fed committee members to leave six years of zero percent interest-rate policy in the rear view mirror is adversely affecting bond yields across the globe; in fact, those yields are adversely affecting every asset with a dividend, distribution or a yield as prices readjust. Rising borrowing costs also hamper mortgage activity as well as reduce the likelihood of corporate borrowing for buybacks. Indeed, unless 3.5%-plus G.D.P. growth occurs out of thin air – in an environment where 2% has been the norm alongside unprecedented stimulus measures – any trend toward tightening is likely to create the fear of a recession or an actual recession.
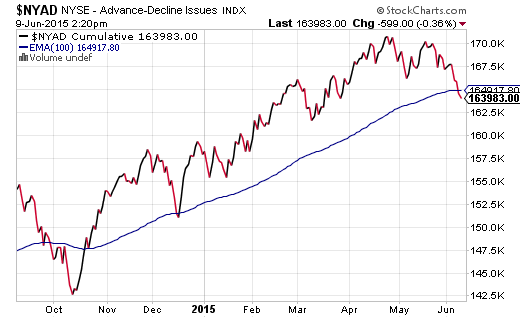
You do not have to take my word for it. Market-followers can see the unpleasant developments in the price movement of key indicators. The NYSE A/D Decline Line is breaking below and staying below its exponential 100-day moving average. The last time this happened? The stock market had been tumbling toward its first correction in more than three years last October-November. And what saved the markets? Fed voting member James Bullard famously suggested that asset purchases by the central bank (a.k.a. quantitative easing or “QE”) could be extended or revived at any time by the central bank.

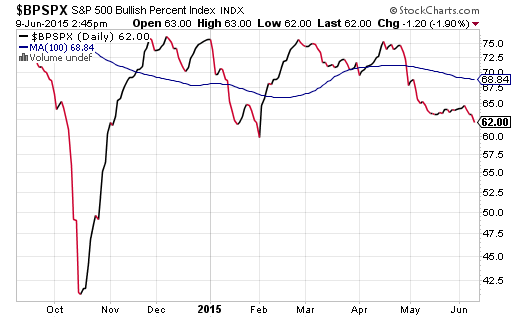
The same type of weakness has developed in the S&P 500. The Bullish Percentage Index (BPI) has fallen to 62%, suggesting less and less participation by components of the heralded benchmark.

In my estimation, absent the Federal Reserve emphasizing the possibility of pushing rate hikes off into the wintertime or even into Q1 2016, cash may be king amid increasing uncertainty and volatility. Many of my clients have 15%-25% in cash equivalents at this time.
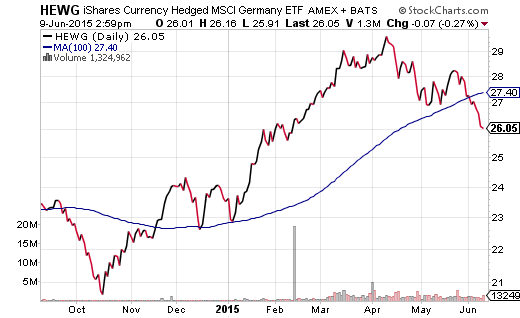
For those who have been tracking my many of my core holdings over the years, I maintain assets such as iShares US Minimum Volatility (NYSE:USMV), Vanguard Mid-Cap Value (NYSE:VOE), iShares S&P 100 (NYSE:OEF), iShares Currency Hedged EAFE (HEFA) and Vanguard FTSE Developed Markets (NYSE:VEA). The higher-than-typical cash level has come from the selling of assets that hit stop-limit loss orders and/or breached key trendlines. We no longer have an allocation to Vanguard Long-Term Bond (ARCA:BLV) in actively managed portfolios; for the most part, we no longer hold iShares Currency Hedged MSCI Germany (NYSE:HEWG).

Disclosure: Gary Gordon, MS, CFP is the president of Pacific Park Financial, Inc., a Registered Investment Adviser with the SEC. Gary Gordon, Pacific Park Financial, Inc, and/or its clients may hold positions in the ETFs, mutual funds, and/or any investment asset mentioned above. The commentary does not constitute individualized investment advice. The opinions offered herein are not personalized recommendations to buy, sell or hold securities. At times, issuers of exchange-traded products compensate Pacific Park Financial, Inc. or its subsidiaries for advertising at the ETF Expert web site. ETF Expert content is created independently of any advertising relationships.
