Last week’s market action didn’t affect our core health indicators too much, but many of the ancillary indicators I watch suffered some damage. While the market looks healthy on the surface there are enough indicators warning to suggest the worst isn’t behind us yet. Currently we have a tale of two markets.
Although our core health indicators are positive, most of them have weak enough readings that they could turn negative over the next few weeks. However, this would be very unusual given the fact that many of them turned positive just last week. Generally, when all of them move above zero they stay there for at least two months. Weakness in these indicators will provide significant warning.
Another indicator that is telling two stories is our core measure of risk. It is still showing low perceptions of risk, but just came out of an overbought condition. This often marks the beginning of corrections larger than 10%.
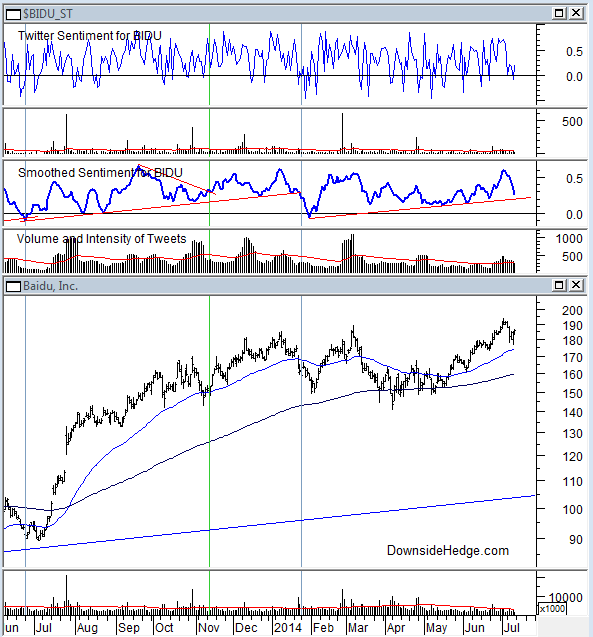
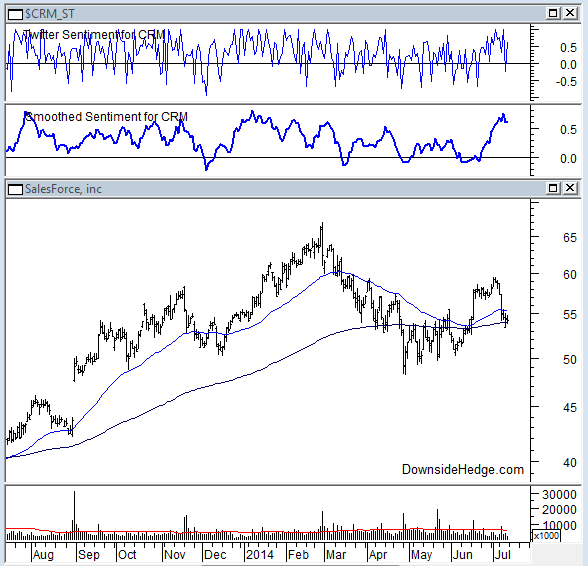
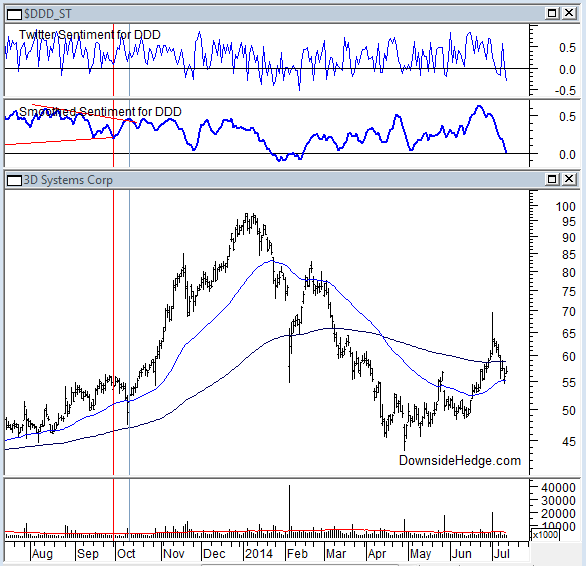
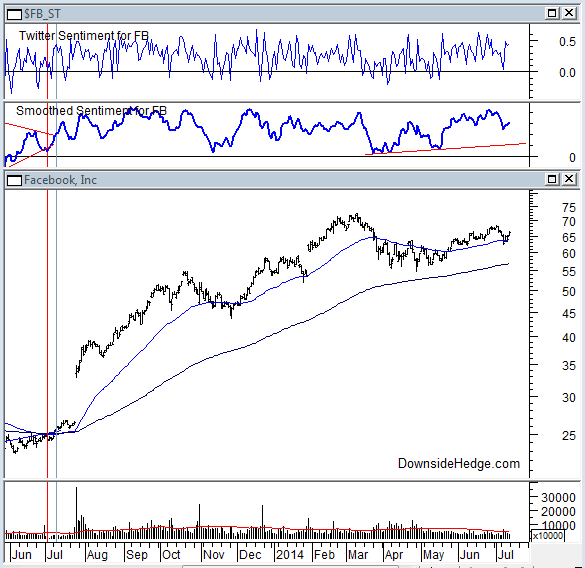
Momentum stocks are also acting indecisive. Many of them have had good runs over the past few months, but are correcting sharply. To confuse matters even more, many of them have fallen to moving averages or breakout points that are now providing support. Below are a few charts (along with several others) I’ll be watching closely. If they break below current support it will be a warning that more downside is ahead for the general market.
Baidu (NASDAQ:BIDU)
SalesForce (NYSE:CRM)
3D Systems (NYSE:DDD)
Facebook (NASDAQ:FB)
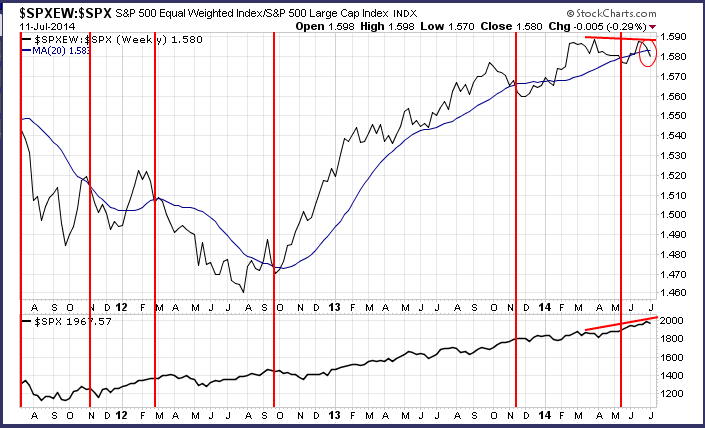
The most sensitive measure of breadth that I follow is the ratio between the S&P 500 Equal Weighted Index (SPXEW) and the S&P 500 itself (SPX). When this ratio falls below its 20 week moving average it warns of choppiness going forward.
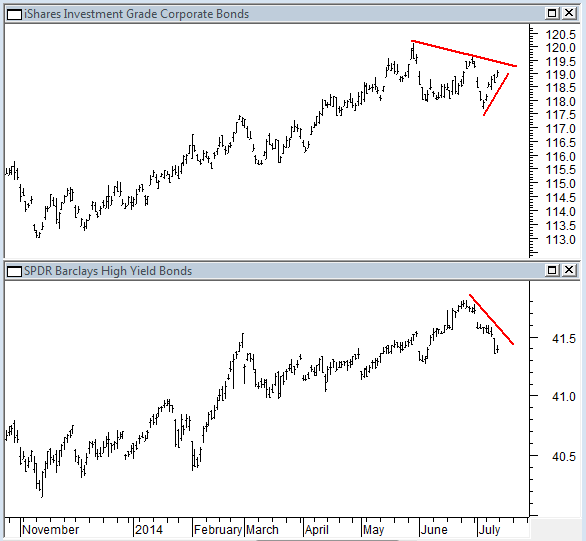
This past week we also saw some damage to junk bonds (SPDR Barclays High Yield Bond ETF (ARCA:JNK)) which indicates market participants are shying away from risk.
Our sentiment indicators for the S&P 500 Index (SPX) from both Twitter and StockTwits issued consolidation warnings on Friday. The rally from 1900 to 1985 on SPX has been met with skepticism from traders on StockTwits and Twitter. As the rally progressed, smoothed sentiment steadily decreased creating a negative divergence from price lasting two months. At the close on Friday, smoothed sentiment broke sharply below a confirming uptrend line that had been in place for over three months. The break of the uptrend line after a negative divergence creates the warning.
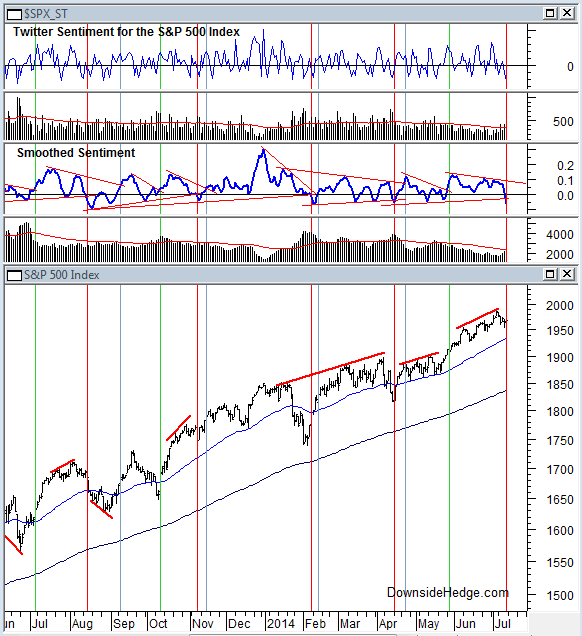
Please note this isn’t a prediction of a long term top, merely warning that the market has lost support from active traders and investors. Recent warnings have been whipsaws that have been closer to market bottoms than tops. This is similar behavior to other indicators I follow and are a reflection of the willingness of people to buy the slightest dip over the last year or so. Nevertheless, the long term odds from this indicator suggest more decline in price.
Support and resistance levels generated from the Twitter stream remain scarce. Traders are increasingly reluctant to target prices above or below the market. This is a sign of indecision, caution, and waiting. Current levels show 2000 on SPX as resistance and 1925 as support.
Sector sentiment suggests a rotation to safety with defensive sectors showing strength and leading sectors lacking support from the Twitter stream.
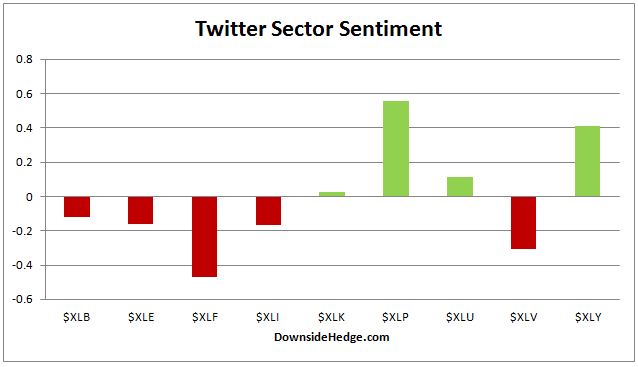
Overall sentiment is suggesting more weakness ahead for the market. A consolidation warning was issued this week, traders still won’t target higher prices, and sectors are suggesting a rotation to safety.
Conclusion
We have a tale of two markets. Core indicators are still positive, perceptions of risk are still low, and beaten up stocks are currently holding support. Unfortunately, our core measure of risk fell from overbought readings which warns of a correction, junk bonds are weak indicating low tolerance for risk, the S&P 500 equal weight index is signalling a rotation to safety, and traders on StockTwits and Twitter aren’t supporting the market.
The critical thing to watch in the next few weeks will be if momentum stocks hold current support levels. If they can hold and continue higher they’ll push the market up with them. If they start to break down I’ll get very concerned.