ETF investors are likely measuring the resilience and relative performance of their portfolios during the latest 6-month jump in interest rates. Bond funds are the obvious areas of concern in terms of volatility. However, many stock and equity-income asset classes maintain a high sensitivity to Treasury yield fluctuations as well.
REITs certainly fall into this category and are one of the few sectors of the market currently trading well off their highs. As I wrote in September, inflection points in interest rates typically signal a change of trend for these assets.
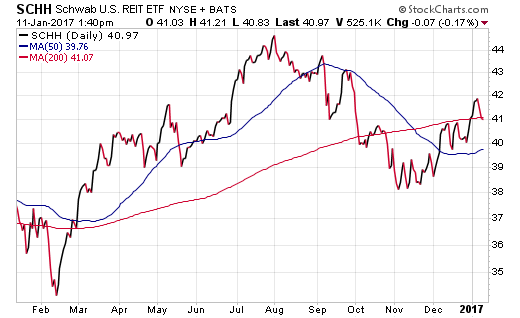
Looking at a chart of the Charles Schwab (NYSE:SCHW) US REIT (NYSE:SCHH), it’s clear that we have now seen a notable correction from the July peak followed by stabilizing price action. The chart patterns continue to demonstrate successive higher highs and higher lows since the November bottom. This type of price action appears to be quite healthy in the near-term and is why I am turning favorable on this sector to start 2017.

SCHH tracks over 100 U.S. publicly traded real estate investment trusts in a market-cap weighted structure. This index represents a solid benchmark of the REIT sector for a minimal expense of just 0.07% annually. It also currently sports a 30-day SEC yield of 2.80%, with dividends paid quarterly to shareholders.
We recently added this position as a tactical holding for subscribers to the Flexible Growth and Income Report. The resurgence in price, coupled with the strong dividend yield, and access to an alternative income producing sector were the primary considerations for this decision. Overall, SCHH represents a small portion of the diversified portfolio and will need to maintain its technical strength to remain part of the mix.
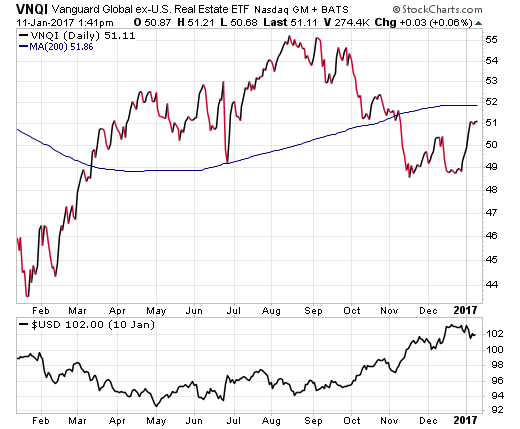
Turning to the international front, the Vanguard Global ex-US Real Estate (NASDAQ:VNQI) has demonstrated similar price action to its domestic peers. This index represents nearly 700 investable real estate stocks in both developed and emerging markets outside the United States.

The most pressing concern for overseas investments has been the strength of the U.S. dollar over the last six months (see bottom of chart). This factor acts as a fundamental headwind to traditional unhedged international funds like VNQI. If we start to see a resurgence in foreign currency prices during 2017, it could help buoy international REITs substantially.
The Bottom Line
In my opinion, REIT ETFs can offer many benefits within the context of a diversified growth or income portfolio. They sport generous yields, are low-cost, and offer a varying risk dynamic than traditional stocks or bonds. Nevertheless, they should be owned in moderation and are susceptible to both interest rate and broad-market volatility. That is why investors should closely evaluate their REIT exposure to ensure their current allocation is in line with their risk tolerance.
Disclosure : FMD Capital Management, its executives, and/or its clients June hold positions in the ETFs, mutual funds or any investment asset mentioned in this article. The commentary does not constitute individualized investment advice. The opinions offered herein are not personalized recommendations to buy, sell or hold securities.
