Real Estate Investment Trusts, or REITs, have become a prominent segment of the stock market over the last several decades. These investments have become so popular that the Global Industry Classification Standard (GICS) recently split them off from the financial sector to form its own standalone category. REITs are now considered a key player within the S&P 500 index and other major U.S. benchmarks.
This comes as no surprise to ETF investors, who have owned or tracked diversified pools of REITs for quite some time now. The iShares U.S. Real Estate ETF (NYSE:IYR) celebrated its 16th birthday this year. This fund owns a pool of 116 publicly traded REITs with over $4.6 billion in total assets.
Since inception, IYR has an annualized total return (with dividends included) of 10.44% through August 31. That’s an impressive track record considering the extreme drop this fund experienced during the financial crisis of 2008-2009.
While IYR is one of the oldest funds in this class, it’s not the most popular. That honor goes to the Vanguard REIT ETF (NYSE:VNQ), which is home to a staggering $36.5 billion spread among 150 public REITs. One primary reason for this gap is the minimal 0.12% expense ratio VNQ charges compared to 0.44% for IYR.
In total, there are more than 40 ETFs in this category that cater to a variety of benchmarks, sectors, and geographies. This diverse menu of options allows investors the flexibility to tailor their exposure any way that they like it.
Love Those Dividend Yields
One of the biggest attractions for REIT ETFs are their above-average dividend yields. IYR currently yields 3.33% compared to just 2.00% on the iShares S&P 500 ETF (NYSE:IVV). That’s a solid relative gain for income investors or those looking to diversify their holdings toward asset classes that don’t strictly behave like conventional stocks or bonds.
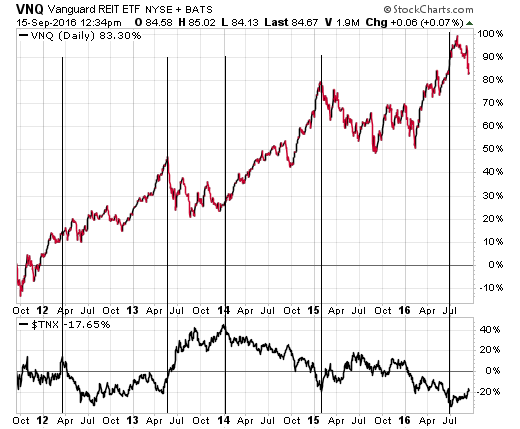
It should also come as no surprise that one of the greatest drivers of overall momentum in the REIT category are interest rates. Lower rates are typically bullish for real estate because they facilitate activity like buying, selling, and re-financing. Therefore, when we have experienced a moderate uptick in rates in the past, these investments tend to underperform. The chart below shows the 5-year history of VNQ versus the 10-Year Treasury Note Yield on the bottom.

Note the periods where major turns in interest rates have occurred (black vertical lines). While there are some exceptions to the rule, this sector is typically inversely correlated with changes in intermediate-term Treasury bond yields, similar to bonds. This is likely the primary reason for the recent peak that developed in August. A sharp V-bottom in interest rates facilitated a pullback in the underlying REITs that make up the VNQ and IYR portfolios.
Investors who have owned these funds through prior pullbacks may be prone to ignore these signals and wait out the recent correction. Timing the machinations of each sector of the market can be difficult unless you are working with a short-term time horizon and disciplined risk management tools.
Nevertheless, if we are due for a longer time frame directional change on interest rates, then you should adjust your return expectations on REITs accordingly. This sector may undergo a period of heightened volatility and potentially underperform its historical returns if the tide continues higher.
The Bottom Line
REITs can be an attractive way to enhance the yield of your portfolio and participate in an alternative asset class. They also provide significant diversification qualities and can undergo differentiated price characteristics than conventional stocks or bonds.
Those who are evaluating exposure to this sector should be cognizant of the correlation to interest rate trends and the recent patterns that suggest cautionary signs. While the long-term trend remains intact, there are structural hurdles that will need to be overcome in order for the strength to resume.
