T2108 Status: 44.8%
T2107 Status: 24.5%
VIX Status: 19.5
General (Short-term) Trading Call: Bullish (upside target of 1996 on the S&P 500 before overbought conditions finally occur again.
Active T2108 periods: Day #2 over 20%, Day #1 over 30% (ends 12 days under 30%), Day #1 over 40% (ends 33 days under 40%)(underperiod), #94 under 50%, Day #111 under 60%, Day #316 under 70%
Commentary
The S&P 500 (via SPDR S&P 500 (NYSE:SPY)) printed a near picture-perfect follow-through to the end of the last oversold period yesterday. The index gapped up and just ripped higher for the rest of the day. The move pinned bears, who were too greedy to release their grips on positions during the oversold period, into a world of hurt.
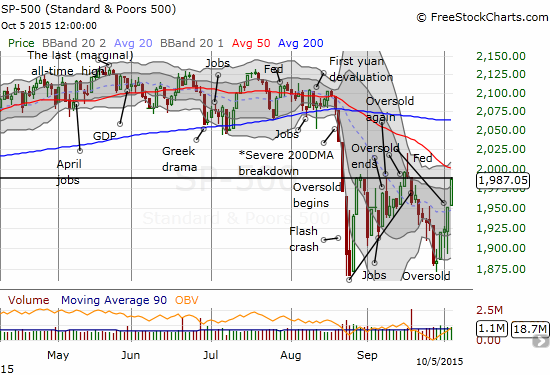
The S&P 500 (SPY) soars back to the 1987 pivot point with downtrending 50DMA resistance looming overhead
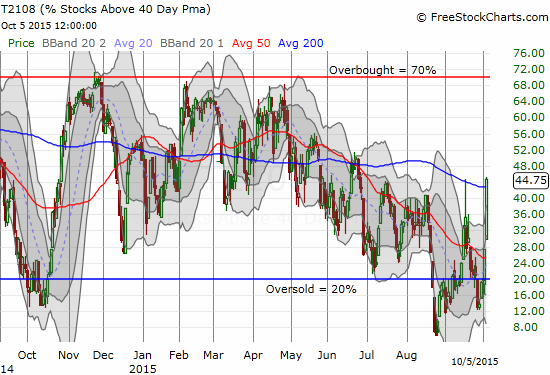
Accordingly, T2108 surged. My favorite technical indicator gained a whopping 63% to end the day at 44.8%. This move put an end to the primary downtrend defined by the 50DMA.
T2108 has now cleared ALL the angst in place since July.
The volatility index, the VIX, looks ready to reverse all the angst of the past few months just as T2108 has done already.
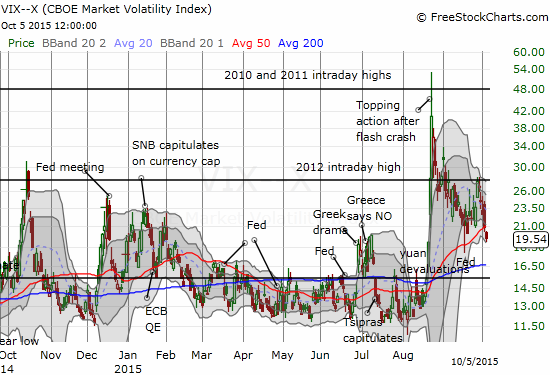
The VIX closes below its 50DMA in a move that looks like a resumption of the previous downtrend from the flash crash high
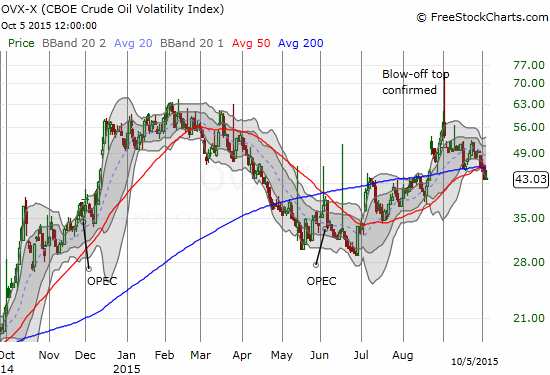
The volatility on oil is also beating a retreat. The CBOE Crude Oil Volatility Index (OVX) has confirmed the blow-off top from a month ago with a confirmed breakdown from 50 and 200DMA support. This decline has put my anti-volatility, rangebound bet on United States Oil (NYSE:USO) into the green.
The CBOE Crude Oil Volatility Index (OVX) is calming down again
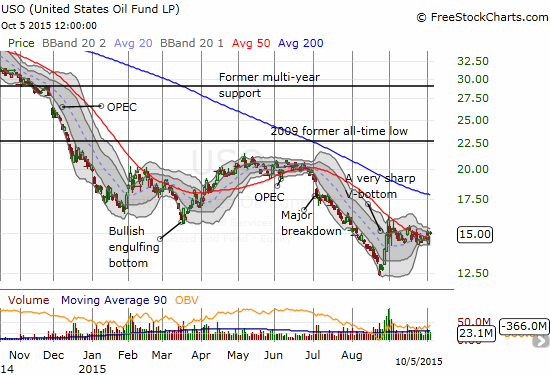
After a sharp bounce from all-time lows, the United States Oil ETF (USO) seems to be settling into a trading for now
Big cap tech is back in effect. Amazon.com (NASDAQ:AMZN) clocked its second highest close ever and Netflix (NASDAQ:NFLX) finally broke through 50DMA resistance. I remain bullish on AMZN, but I am going to wait and see before I change my standing bearish technical opinion on NFLX.
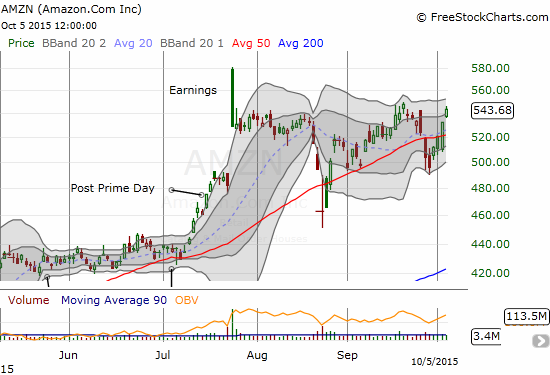
Amazon.com has remained relatively resilient through these months of angst even after the “gap and crap” from its last earnings release.
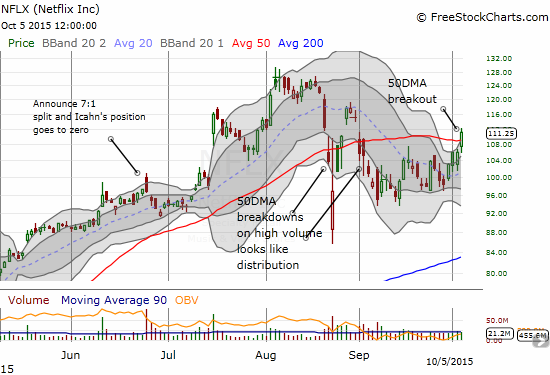
Netflix (NFLX) breaks out from 50DMA resistance and makes a strong bid to reverse its bearish technical position.
It seems like a time to jump for joy and celebrate. However, there are a number of important caveats to keep in focus. These points should at least slow down anyone who is late to this rebound because they chose to sit in fear rather than buy in the oversold period(s).
- The S&P 500 closed right at the 1987 pivot that has somehow become important since the first oversold period began. More importantly, the 50DMA looms overhead as downtrending resistance.
- The S&P 500 is just 9 points, less than a fraction of a percent, away from my upside target (see the trading call above). At least the good news here is that T2108 is still nowhere near overbought status here.
- My new favorite for speculative fervor, the iShares Nasdaq Biotechnology ETF (NASDAQ:IBB), faded after an initial gain. I was quite surprised to see such a dramatic shift to relative weakness. Chart below.
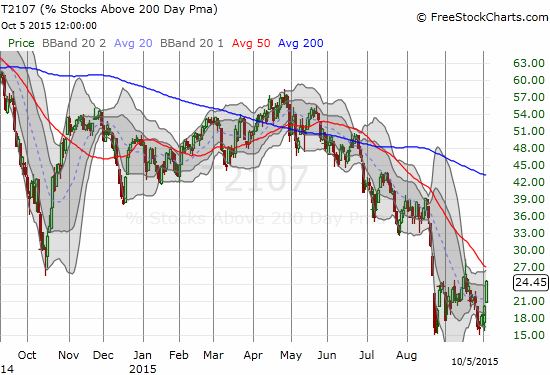
- T2107, the percentage of stocks trading above their 200DMAs, is still well within the range of the angst from the past several months. The GOOD side of this position is that if the S&P 500 does indeed manage a 50DMA breakthrough soon, T2107 is telling us there could be significant upside ahead as stocks rise to test 200DMA resistance points. See chart below.
- The Australian dollar (via Guggenheim CurrencyShares Australian Dollar ETF (NYSE:FXA)) has also not confirmed or lead a breakout. Against the Japanese yen (via Guggenheim CurrencyShares Japanese Yen (NYSE:FXY)), one of the currency market’s favorite indicators of risk appetite remains below a downtrending 50DMA. See chart below. At the time of writing, the release of the Reserve Bank of Australia’s latest decision on monetary policy is sparking a further relief rally even though the RBA said nothing new or surprising.
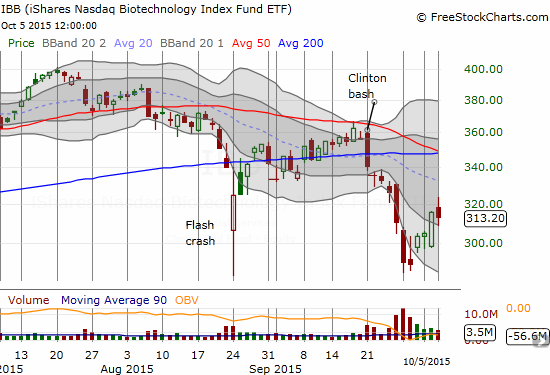
The iShares Nasdaq Biotechnology ETF (IBB) reversed course and significantly trailed the rest of the celebratory market.
T2107 has a looooong way to go before even a semblance of “normalization”
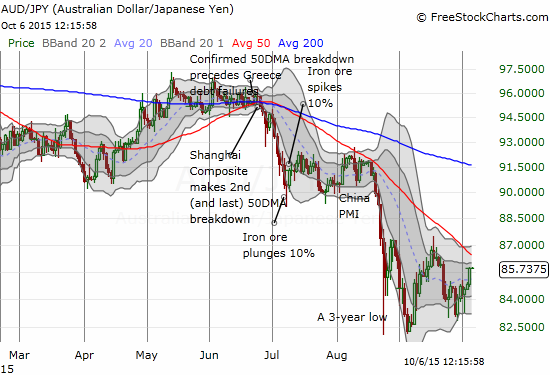
A relief rally on AUD/JPY continues with a big test coming up soon against downtrending 50DMA resistance
Mind you, I am far from bearish. I would love to see the market continue to power higher from here. However, given I went into the last oversold period very slim on hedges (and per rules, I closed out most of them at that time), I have used this strong, yet unproven, rally as an opportunity to rebuild some hedges. My favorite, Caterpillar (NYSE:CAT), is experiencing a VERY strong relief rally. CAT soared 5.3% on the day yesterday and has gained about 10% from its post-earnings low. A close right below the downtrending 20DMA marks a good spot to rebuild my favorite hedge against bullishness.
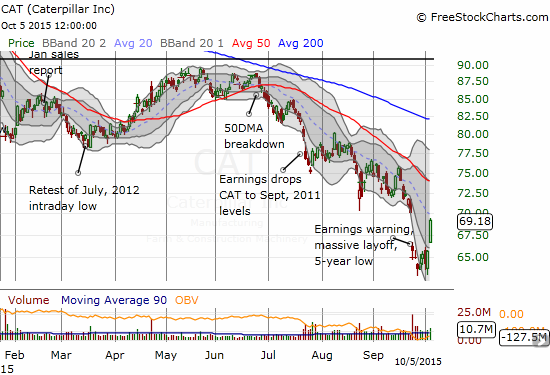
The rally off the lows for Caterpillar (CAT) has carried the stock well into its gap down from earnings.
Next up, earnings season!
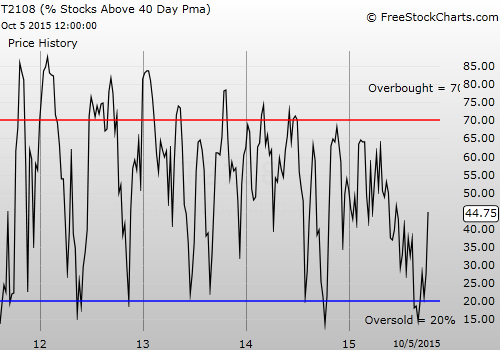
Daily T2108 vs the S&P 500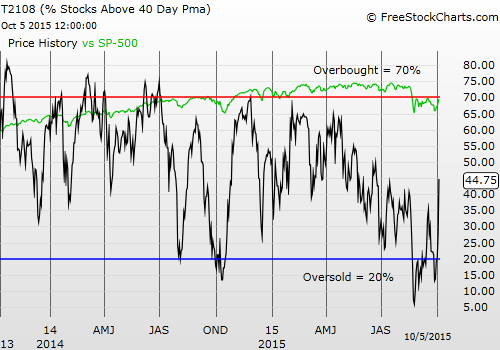
Black line: T2108 (measured on the right); Green line: S&P 500 (for comparative purposes)
Red line: T2108 Overbought (70%); Blue line: T2108 Oversold (20%)
Full disclosure: long SVXY shares, long SSO shares, long IBB call options, short CAT, short USO put options and call spread, short AUD/JPY

