
T2108 Status: 36.8%
T2107 Status: 47.0%
VIX Status: 14.2
General (Short-term) Trading Call: Neutral with a “bullish bias”
Active T2108 periods: Day #158 over 20%, Day #117 above 30%, Day #2 under 40% (underperiod), Day #10 under 50%, Day #28 under 60%, Day #227 under 70%
Commentary
A week ago, I wrote in the T2108 Update that another crack had appeared in the chop that is the S&P 500 (via the SPDR S&P 500 ETF (ARCA:SPY)). T2107, the percentage of stocks trading above their respective 200DMAs, had lost momentum and was breaking down. T2107 spent the week churning up and down until it finally followed through lower on Friday. However, a strong bounce to close out trading on the day flipped the downward bias to an upward one. Without T2107 or T2108, it would be hard to see from the chart of the S&P 500 that the index is actually poised for a bounce.
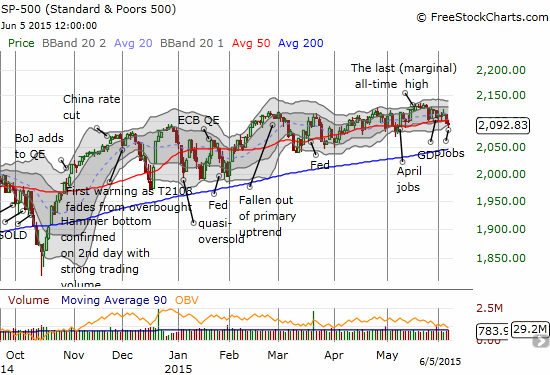
The S&P 500 makes a fresh trip below its 50-day moving average (DMA) pivot line
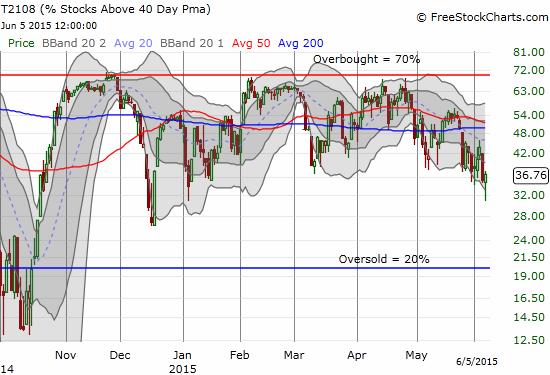
Like T2107, T2108 makes a strong bounce off its lows forming a “hammer” pattern
The chart above shows that T2108, like T2107, made a strong bounce from its lows. The resulting pattern is known as a “hammer”; it represents a rush of buyers (and/or short-covering) that fills the vacuum left by exhausted sellers. It was this rush the prevented the S&P 500 from making a more ominous trade lower below its 50DMA pivot. I took this opportunity to double down on some call options on ProShares Ultra S&P500 (ARCA:SSO). I purchased the first tranche on Thursday as T2108 retested lows of the current trading range. I added more on Friday because around 30% has often served as “close enough” to oversold for T2108. I do not plan to buy more until/unless T2108 hits actual oversold levels (below 20%).
The volatility index (the VIX) also supports the prospects for a bounce as it faded from the very long-standing pivot line at 15.35.
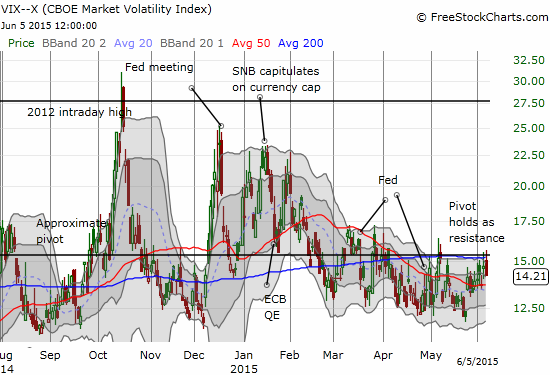
For two days in a row, the volatility index fails to break through resistance at the pivot line
This resistance is of course bad for my call options on ProShares Ultra VIX Short-Term Futures ETF (ARCA:UVXY). Rather than bailing on them, I decided to hold them as a small hedge.
The week was full of news on the economy and monetary policy here in the U.S. and major economies across the globe. Together they caused a lot of churn, some of which is not apparent without reviewing intraday charts. I will stick to the daily charts in this review of what interests me going into this trading week.
Apple
The pre-WWDC trade did not work out last week as Apple (NASDAQ:AAPL) slowly drifted back to its 50DMA. When I laid out the plan for this trade, I noted the tendency for AAPL to gravitate toward this pivot as a primary risk. I still have some call options expiring this Friday. I may add more depending on Monday’s trading as I think AAPL is now poised to bounce.
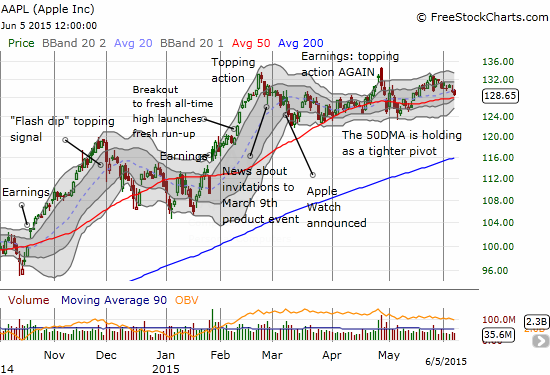
Over the past week, Apple (AAPL) traded straight down toward its 50DMA
Shake Shack
Shake Shack (NYSE:SHAK) has definitely become my favorite stock to watch and not trade. I have featured it in several posts – so far, so good on calling it from the sidelines. Now, SHAK looks poised for another bounce as it made a very low volume retest of its 20DMA upward trend. It closed out the week with a nice “doji” that signals the end of the little selling momentum that was there. If I decide to trade this one, I will do my best to send up the smoke signals on StockTwits and Twitter.

Shake Shack (SHAK) looks poised for another attempt to invalidate the topping pattern now in place
iShares 20+ Year Treasury Bond ETF
While the path to resistance was not a straight-line, my bullish call on the iShares 20+ Year Treasury Bond (ARCA:TLT) did work out. Unfortunately, I held out for more instead of seeing the difficulty likely in store for TLT to make more progress past stiff resistane at the 200DMA. My existing position blinded me to this classic short setup. TLT has now (re)confirmed an on-going breakdown.

iShares 20+ Year Treasury Bond ETF (TLT) sets up a classic short as it fails at 200DMA resistance
LinkedIn Corporation
LinkedIn Corporation (NYSE:LNKD) is already bouncing and my post-earnings position is now working quite well. Unlike TLT, I will be quite ready to lock in profits if/when LNKD retests overhead resistance at the now converged 50 and 200DMAs. LNKD has a MONSTER post-earnings gap down to fill which I think will take considerable time to heal.

LinkedIn Corporation (LNKD) has finally sprung back to life but overhead resistance should prove tough
iShares MSCI Emerging Markets ETF
I last talked about iShares MSCI Emerging Markets (ARCA:EEM) a month ago. I had a great closeout of put options and planned to ride the long side of my hedge (call options) on the house’s money. EEM has YET to regain any lift since then. Indeed, EEM has suffered a very bad double breakdown below its 50DMA and then, more importantly, its 200DMA.
The second breakdown motivated me to load up on a fresh hedge: new put options and new call options (I am still sitting on the old ones, almost worthless now). Sure enough, EEM followed through on the breakdown the next day. I have not taken profits. The momentum is clearly against EEM here, and I have time to see how this plays out. I think if EEM experiences another of those immediate turn-arounds, I should have time to pay for the put options with profits on the call options. I think a bounce could slice right through the 200DMA before losing steam at the 50DMA. Stay tuned.

EEM is still breaking down
Daily T2108 vs the S&P 500
")
Black line: T2108 (measured on the right); Green line: S&P 500 (for comparative purposes)
Red line: T2108 Overbought (70%); Blue line: T2108 Oversold (20%)

Be careful out there!
Full disclosure: long UVXY call options, long AAPL call options, long TLT call options