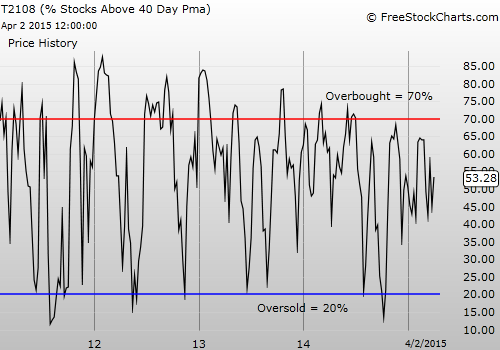
T2108 Status: 53.3%
T2107 Status: 51.8%
VIX Status: 14.7
General (Short-term) Trading Call: Neutral. Market still seems stuck in a chopfest
Active T2108 periods: Day #114 over 20%, Day #73 above 30%, Day #17 above 40%, Day #1 over 50% (overperiod), Day #20 under 60%, Day #184 under 70%
Commentary
The market was closed on Friday, April 3rd, so we still have to wait until later today, Monday, April 6 to see how the market reacts to the job report for March. If the drop in the U.S. dollar is any indication, the market should at least open lower.
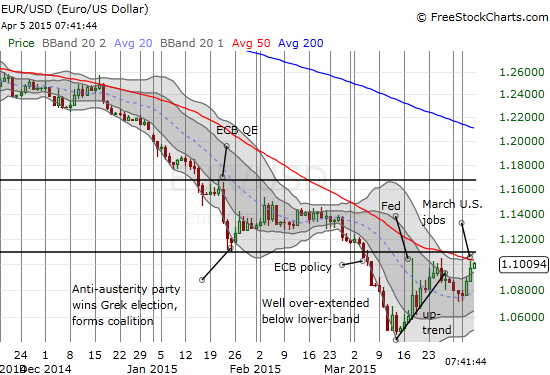
The euro is headed right back to the earlier (presumed) trading range against the U.S. dollar
Then again, the U.S. market supposedly does not like a strong dollar. If so, it stands to reason that stocks could rally. After all, a poor jobs report means the Fed stays easier for longer.
This ability, to make rational-sounding arguments for both upside and downside, defines quite well the case for more chop ahead. The S&P 500 (via the SPDR S&P 500 ETF (ARCA:SPY)) is essentially now trapped in a 5-month long trading range that seems ready to extend yet longer…awaiting the next strong catalyst.
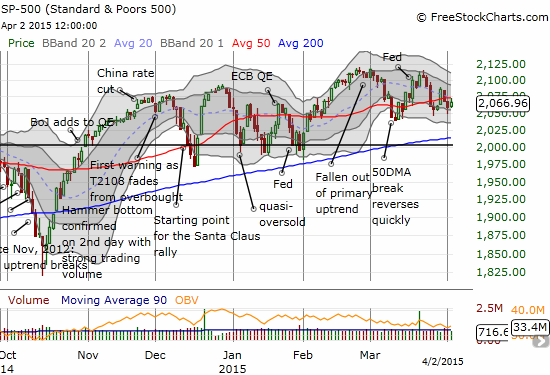
Chopfest: The S&P 500 is now in a 5-month extended trading range
The volatility index (VIX) is also just bouncing around the quite reliable 15.35 pivot point.
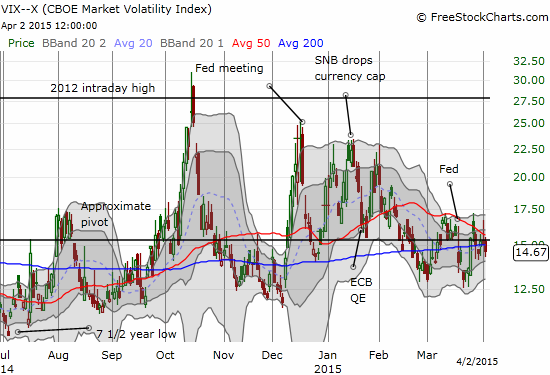
The volatility index, the VIX, continues to bounce around the 15.35 pivot point
In this kind of environment, I have shortened my trading windows and have been more willing, indeed more eager, to end trades within a day or two – same-day if I can catch them that quickly. Earnings season is now around the corner again, so we should expect to brace ourselves for quick sentiment swings as this chopfest continues to cut its way through traders.
I wrote the last T2108 Update for March 26th. The S&P 500 has gained a mere 10 points since then for a 0.4% gain. At the time, the S&P 500 had reversed all of its post-Fed gains, and I had expected gold and oil to soon do their own reversals. The renewed weakness in the dollar likely means that gold will continue to levitate.
Oil is much more of a wildcard given its triple dependence on supply, demand, and the U.S. dollar. However, it seems that the bottom in oil I pointed out earlier has been confirmed for now. I think the United States Oil ETF (NYSE:USO) will provide great opportunities for range-bound trading. As an example, I played USO resistance at the 50DMA and quickly took profits the next day. The chart below shows the importance of the 50DMA. A close above the high on March 26th could next propel USO toward $20 which SHOULD serve as the next point of tough resistance.
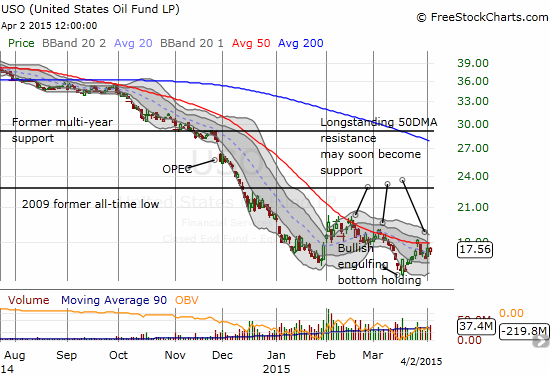
With a bottom seemingly confirmed, United States Oil ETF (USO) will likely soon break 50DMA resistance and turn it into support
The 50DMA has held as stiff resistance for USO since the decline in oil took hold in July, 2014. Imagine, a simple technical breakdown back then was all you needed to make a lot of money shorting oil; no over-analysis, no false comfort in OPEC’s manipulation needed. Too bad I was not paying close enough attention at the time! Now, the churn in USO since it spiked higher off January lows has started turning the 50DMA from convex to concave. This changing dynamic is the stuff of which bottoms are made…
In currency markets, I have used the dollar’s weakness to open up new dollar-long trades and slightly extend existing ones. I think over the course of time, the dollar will resume its uptrend. I am taking advantage of volatility along the way with more rapid fire trades.
Daily T2108 vs the S&P 500
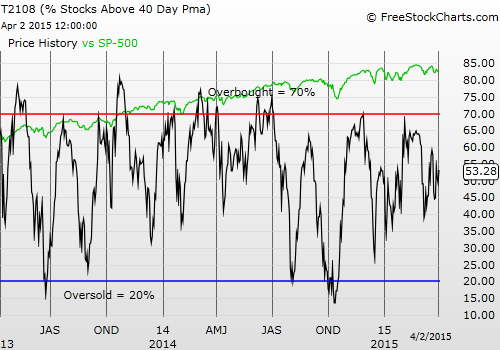
Black line: T2108 (measured on the right); Green line: S&P 500 (for comparative purposes)
Red line: T2108 Overbought (70%); Blue line: T2108 Oversold (20%)
Weekly T2108
Be careful out there!
Full disclosure: net long the U.S. dollar, long UVXY call options
