As I have written about in the past (here, here and here) the last five trading days of the month tend to be “the best of times” for t-bonds. T-bonds have showed a particularly strong historical tendency to perform well during the last five days of August.
First the chart, then the numbers.
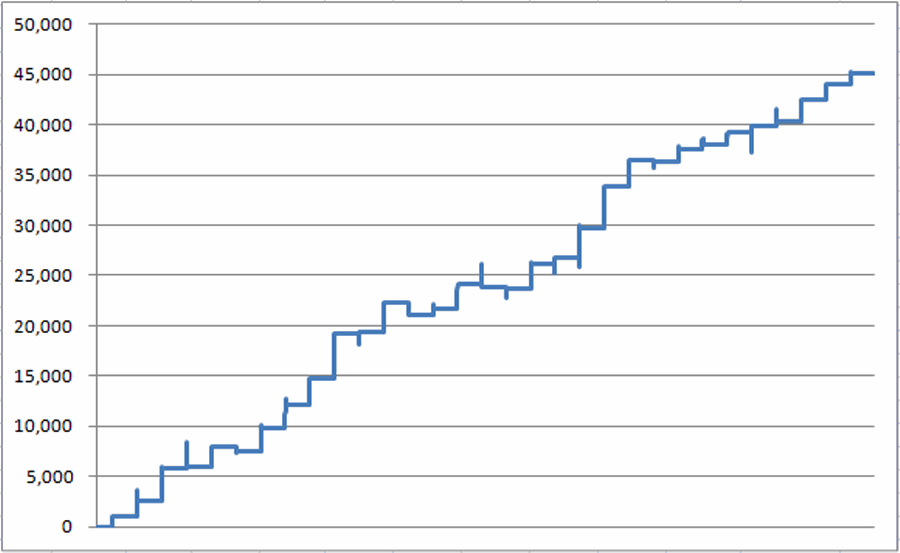
Figure 1 displays the growth in equity achieved by holding a long 1-lot position in Treasury bond futures (a 1-point move in price =$1,000 change in equity) during the last 5 trading days of August starting in 1984.

Figure 1 – Growth of equity holding long 1-lot position in T-bond futures during last 5 trading days of August (1984-2014)
Like any equity curve, it’s not perfect…..but I’ve seen worse. Figure 2 displays the annual gain of loss achieved by holding a long 1-lot position in Treasury bond futures during the last 5 trading days of August again starting in 1984.
| Year | $ +(-) |
| 1984 | 1,031 |
| 1985 | 1,531 |
| 1986 | 3,281 |
| 1987 | 156 |
| 1988 | 2,031 |
| 1989 | (531) |
| 1990 | 2,281 |
| 1991 | 2,281 |
| 1992 | 2,656 |
| 1993 | 4,469 |
| 1994 | 156 |
| 1995 | 3,031 |
| 1996 | (1,281) |
| 1997 | 531 |
| 1998 | 2,500 |
| 1999 | (250) |
| 2000 | (250) |
| 2001 | 2,469 |
| 2002 | 656 |
| 2003 | 2,938 |
| 2004 | 4,219 |
| 2005 | 2,500 |
| 2006 | (94) |
| 2007 | 1,188 |
| 2008 | 500 |
| 2009 | 1,234 |
| 2010 | 688 |
| 2011 | 469 |
| 2012 | 2,125 |
| 2013 | 1,531 |
| 2014 | 1,094 |
Figure 2 – Year-by-Year Results for T-Bonds last 5 trading days of August
For the record:
*Bonds showed a gain 26 times (83.8%)
*Bonds showed a loss 5 times (16.2%)
*The average $ gain was +$1,828
*The average $ loss was (-$481)
So all told an 84% success rate and a 3.8 profit/loss ratio.
Again, I’ve seen worse.
The Fly in the Ointment
As always, the problem with utilizing any seasonal trend is that there is no guarantee that it will work “this time around”. With the “inevitable/ Calamitous” Fed rate hike hanging over the market, there is an “air of risk” associated with a long position in t-bonds.
The “bullish” five day period begins this year at the close of trading on 8/24 and ends at the close on 8/31.
