First the (potential) good news. The (potential) good news is that one trend in bonds that I wrote about a while back here and here may finally (potentially) be playing out the “right way.” Although, as there are still three more trading days left in the month of May, it is clearly a little early to declare “victory.”
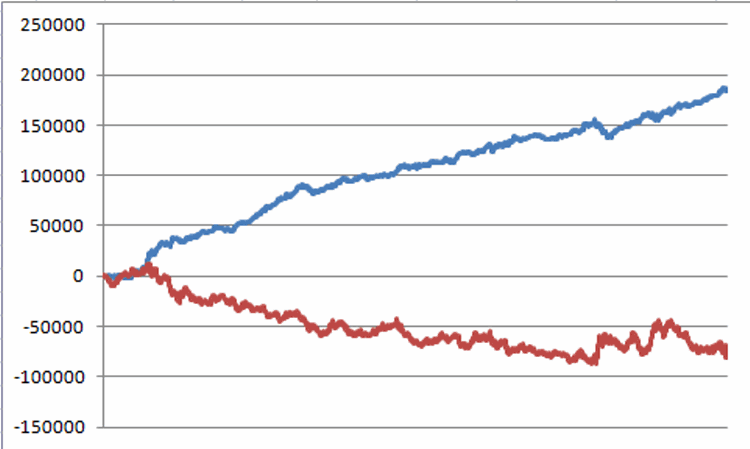
In any event, the trend I am referring to is the historical propensity for t-bonds to advance in price during the last five trading days of the month. Figure 1 displays the growth of equity achieved by holding a long position in t-bond futures during the last five trading days of every month since 12/31/1983 versus the performance for t-bond futures during all other trading days.
Figure 1 – Gain from holding long t-bond futures last 5 trading days of every month (blue line) versus gain(loss) from holding long t-bond futures all other trading days of the month (red line); 12/31/1983-present.
The long-term trend is fairly clear. Ah, there’s the rub. While the long-term is all well and good, the short-term can be a real pain in the you know what. T-bonds lost -$3,800 during the last 5 trading days of March and April combined. Of course, I did point out in a subsequent article that both of these months have been something of “weak sisters” compared to the majority of other months. So what’s the latest buzz? Well on 5/22 – the 5th-to-last trading day of the month of May – t-bonds futures lost another -$625. However, on 5/26 bonds soared in value by $2,219 per contract, so the “last five trading days of the month” period has something of a bullish leg up at the moment. We will just have to wait and see what transpires between now and the close on Friday.
In any event, this constitutes “the Good News” presently in t-bonds. Which leaves us with – what else – the “Bad News”.
The Japanese Stock Market and T-bonds
As I wrote back in late 2013, the U.S. t-bond market has demonstrated a strong tendency to perform inversely to the Japanese stock market. Now for the record, I have heard theories from market analysts whom I consider to be smarter and/or more enlightened than I when it comes to explaining relationships between various – seemingly unrelated – markets regarding “why” this Japanese stocks/U.S. t-bond relationship has been so persistent. However, as a proud graduate of the “School of Whatever Works” I will be candid – I personally don’t care about “why” as much as I do “for how much longer.”
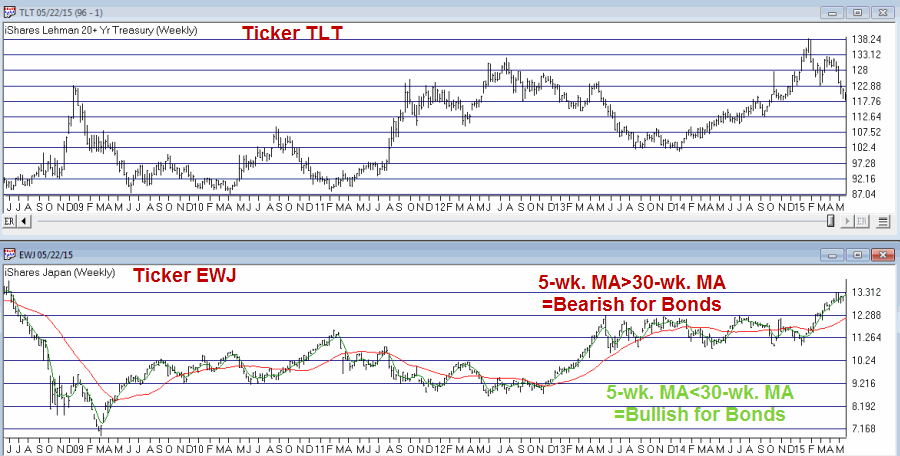
Figure 2 displays ticker (ARCA:TLT) – an ETF that tracks the 20+ Yr. U.S. t-bond in the top clip and ticker (NYSE:EWJ) – an ETF that tracks the MSCI Japan Index – in the bottom clip. Using very simplistic analysis:
*The trend is considered bullish for bonds when the 5-week average for EWJ is below the 30-week average for EWJ, and;
*The trend is considered bearish for bonds when the 5-week average for EWJ is above the 30-week average for EWJ
Figure 2 – T-bonds (ticker TLT) tend to trade inversely to Japanese Stocks (ticker EWJ).
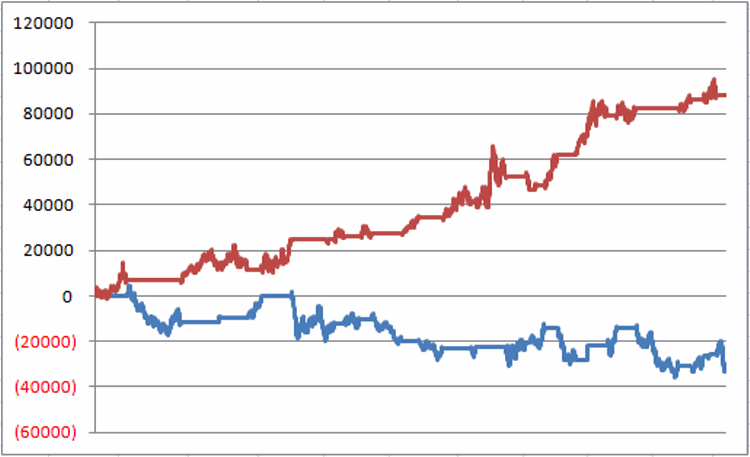
Figure 3 displays the gain achieved by holding a long position in t-bond futures ($1,000 per point) since December 1997 as follows:
*Holding a long position in t-bond futures when the trend is bullish (red line) and;
*Holding a long position in t-bond futures when the trend is bearish (blue line).
Figure 3 – Amount gained or lost being long t-bond futures when EWJ is bullish for bonds (red line) versus bearish for bonds (blue line).
The difference in performance pretty well speaks for itself. So the “bad news” for bonds is that the 5-week average for EWJ remains well above the 30-week average, i.e., this indicator is still “bearish.”
Summary
From a trading perspective I am looking to scratch out some sort of gain from a long position in bonds through the end of May. But from there, the bearish configuration for EWJ as it relates to bonds suggests that a switch either to the short side of bonds, or to simply hold no position at all, might be the way to go.
As always these are not “recommendations”, merely “observations.”
Jay Kaeppel


