Why the U.S. dollar still reigns supreme
It has been over nine years since most stock market indices around the world declared the end of the Great Recession in March 2009. That was when the DJIA and the S&P 500 in the U.S. and the German DAX started recovering from their respective crashes. It was March 2009 when the Swiss stock market fell to 4235 and finally found support, as well.
In January 2018 the Swiss stock market index, which consists of 20 of the largest companies in Switzerland, climbed to a new all-time high of 9616. But instead of catching the flu of optimism, experienced traders and investors tend to worry the most when markets reach new record highs. So let’s take a moment and examine the last nine years through the prism of the Elliott Wave Principle. Hopefully, it will tell us if it still makes sense to join the bulls.
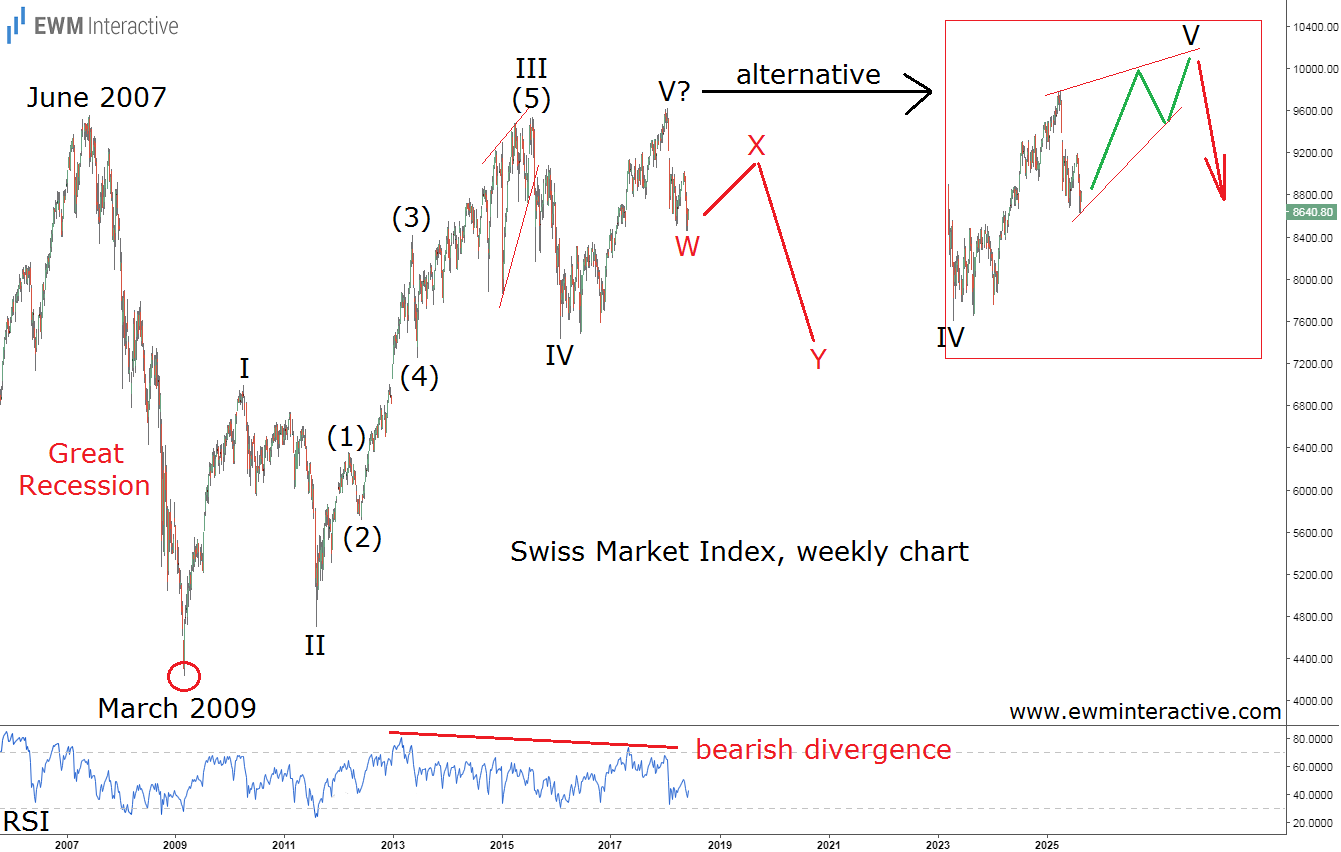
The weekly chart of the Swiss Market Index (SMI) depicts the 2007-2009 crash as well as the following bull market. What interests us is the wave structure of the surge from 4235 in March 2009. As visible, it could easily be seen as a five-wave impulse with an extended wave III, whose sub-waves are also clearly recognizable.
According to the theory, every impulse is followed by a three-wave correction in the opposite direction. In other words, if this count is correct and wave V is over at 9616, the Swiss stock market index should be expected to fall back to the support area of wave IV near 7500, implying at least 13% downside from current levels. A bearish RSI divergence between waves V and III further reinforces the negative outlook.
On the other hand, it might turn out wave V did not end at 9616 and is still in progress as an ending diagonal. If the market chooses this alternative scenario the 10,000 mark is still within the bulls’ reach. In our opinion though, the possibility of gaining 16% in wave V’s last breaths is not worth the risk of losing 13%, especially given the bearish Elliott Wave setup that is already in place on the weekly chart of the Swiss blue chip index.
