Friday we came to the end of another month where we saw a lot of movement in the markets. This also means that we are entering the summer months where traders and investors always seem to want to take some time off. In the past, when we couldn’t access our trading accounts from almost anywhere, this may have had a bigger impact on trading, but we still need to keep it in mind.
As you are looking to trade this summer, it is a good time to be reminded about the important elements in trading. Take some time to review your risk management rules. Understanding how much you are going to risk on each trade as well as how much you will risk overall will help you protect the capital you have. You should also spend some time to review how you analyze the charts to make sure they are meeting the conditions for a setup and a deliberately moving market. Knowing how to identify the trend as well as support and resistance areas can help with this.
This week we continued to be impacted by the news surrounding the US-China trade agreement and whether something is going to work out or not. On Friday, there was also talk about tariffs coming for Mexico. This, along with the issue about collusion and Russian interference in the elections, has continued to concern the markets and are likely to do so for the near future. This upcoming week we are going to have several announcements that may impact the volatility, including the always important Non-Farm Employment numbers.
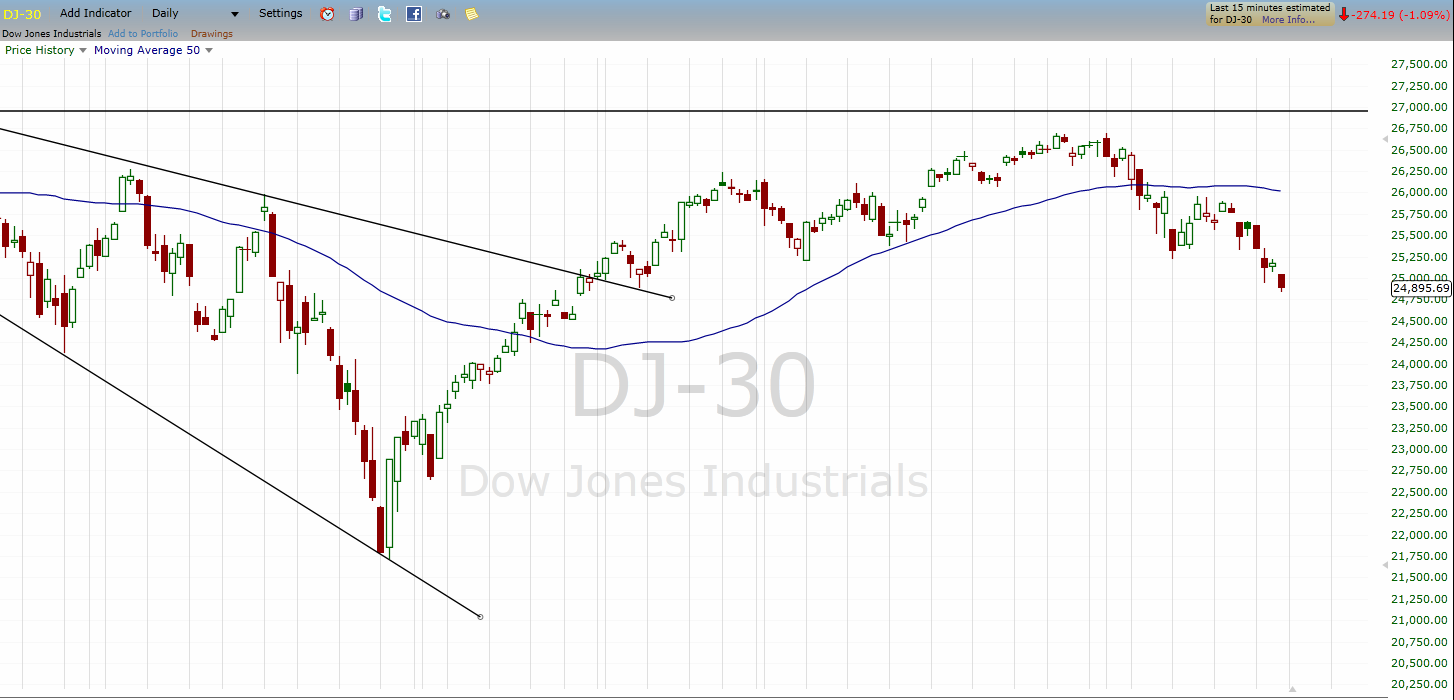
In this last, holiday-shortened week, we saw a continued bearish sentiment in the market as well as some increased overall volatility. Look at the charts below to see what happened this week.
DJ-30:

As we look at the DJ-30, we can see that the prices have continued to move lower as the bears are pushing the price down. This current swing down may be coming to the end of the move and we may see prices try to bounce up from here as it catches support. This is the type of pattern we will see as it makes lower lows and lower highs. This week we also saw the prices break below the recent areas of longer-term support which is also an indication that the selloff may continue.
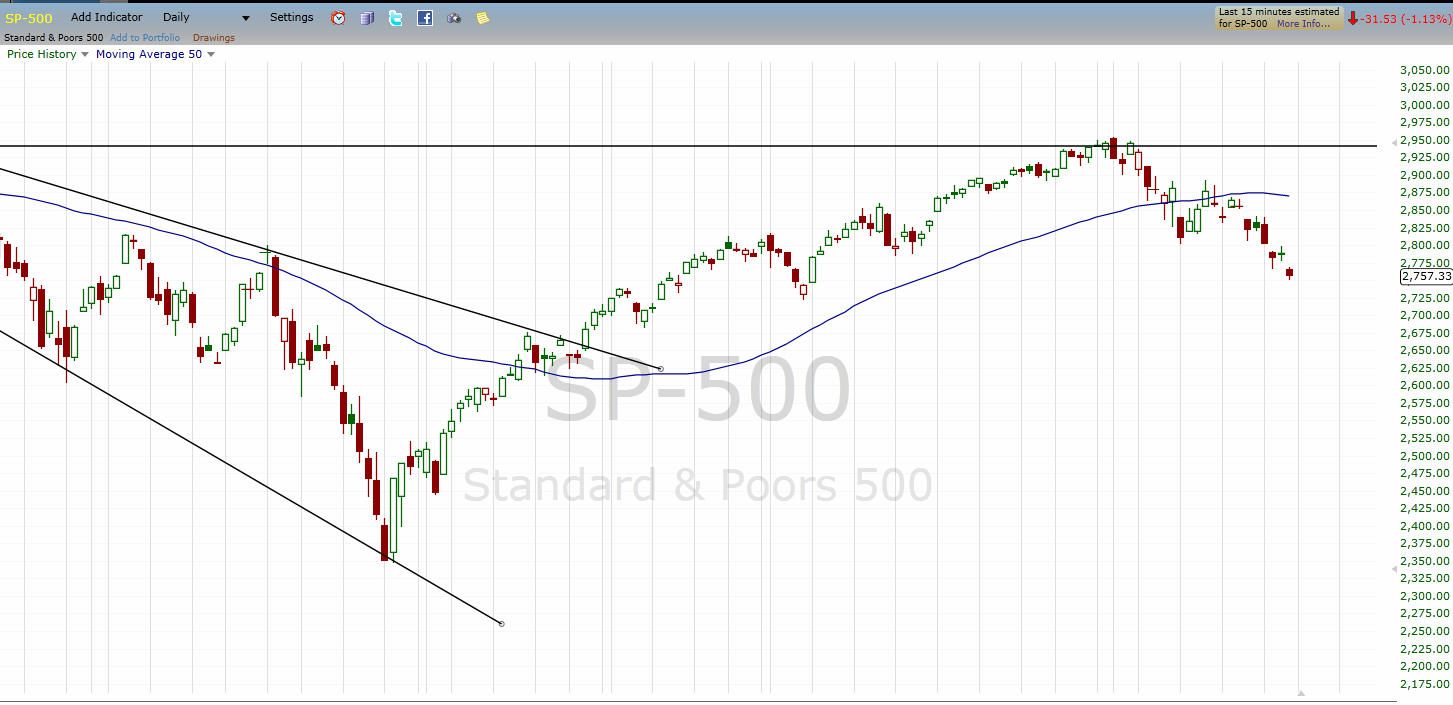
SP-500:

The SP-500, like the DJ-30 has been in a downfall this week. On the chart above we also have the 50-period simple moving average line. You can see that price is trading well below this line which suggests the bears have been controlling price movement but also may suggest it is a bit oversold. This is a good example of a downtrend price pattern where we see the highs moving lower and the lows moving lower also.
