The expected “sugar rush” from more stimulus is why the economy will “run hot” then crash. As every parent knows, giving a child too much “sugar” leads to a “rush” of energy. Then comes the crash, where you find them in some odd place taking a nap.
The Coming Economic 'Rush'
Recently, JPMorgan (NYSE:JPM) joined the rest of the Wall Street banks in predicting a surge in economic activity for 2021 of 6.4%. Of course, the entire reasoning behind the rise in activity was due to “stimulus.”
“In a note to clients, JPM’s chief economist Michael Feroli made the following forecast revisions:
- We now look for a $1.7 trillion fiscal stimulus package (up from $900 billion) to be passed in March
- Even before that kicks in, growth appears to be on firmer footing at the start of the year
- All told we now expect 6.4% (4Q/4Q) GDP growth this year and 2.8% next year
- We see the labor market getting back to full employment, or around 4% unemployment, by 2Q22 and expect core PCE inflation to reach 2.0% by 4Q22, with balanced risks around the outlook.
- While the outlooks for growth and inflation are moving up, Fed rhetoric appears to be getting more dovish” – Zerohedge
The statement quickly lays out the premise of the “rush and crash” syndrome.
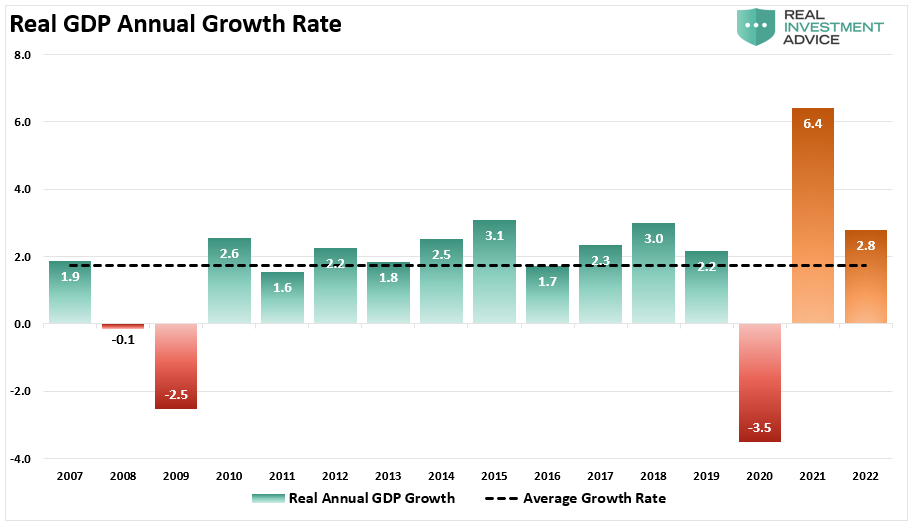
The chart below shows annual real GDP growth rates from 2008 to the present. The surge in GDP in 2021 is a continuation of the “sugar rush” of monetary interventions. However, notice economic growth “crashes” back to annual norms in 2022.
The dashed black line is the average annual growth of GDP from 2007 at just 1.7%. (Without the addition of JP Morgan’s estimates, the actual growth rate through 2020 was only 1.3%).
For reference, a rate of growth below 2% isn’t strong enough to absorb population growth.
(Note: Prior to 2000, an economic growth rate of 2% was considered “pre-recesssionary.” In order to justify excess spending and Government interventions, 2% growth is now considered a “success” of policy.”
It’s All Been Artificial
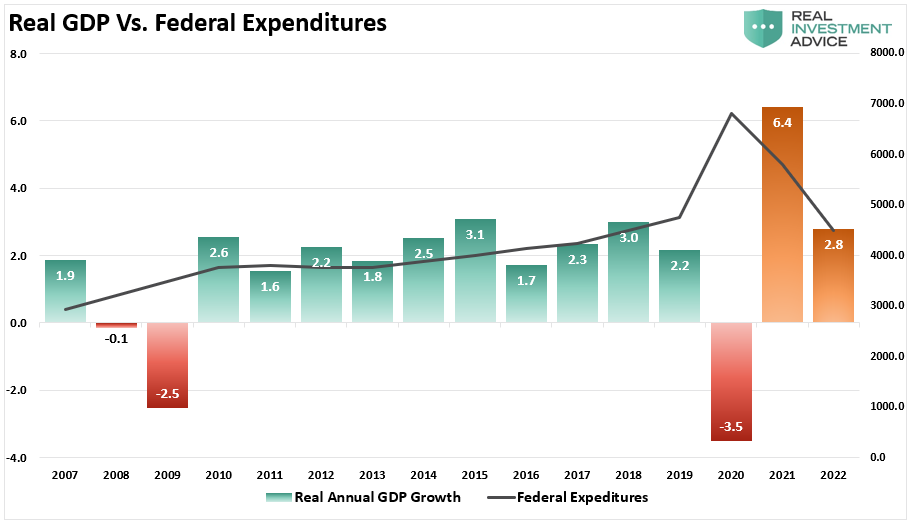
Here is the more significant issue. The vast majority of the growth in the U.S. over the last decade was due to a variety of artificial inputs which are not indefinitely sustainable. From increasing federal expenditures:
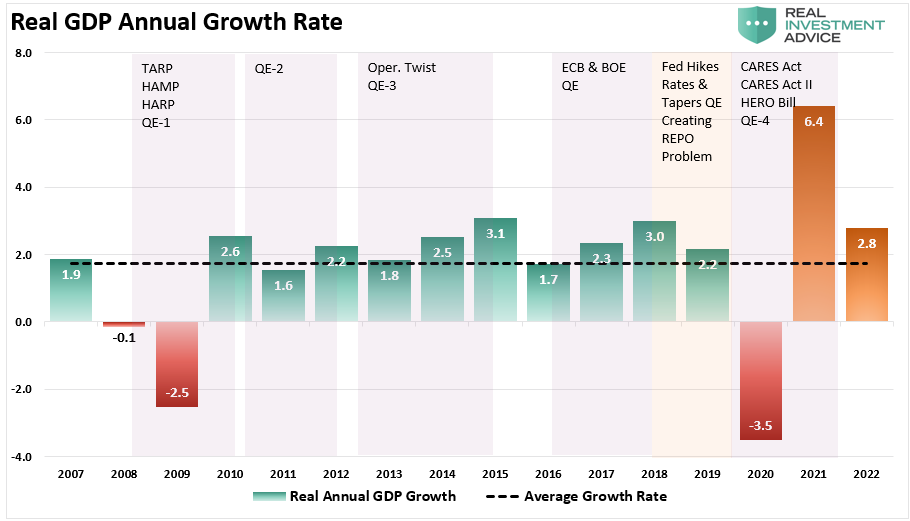
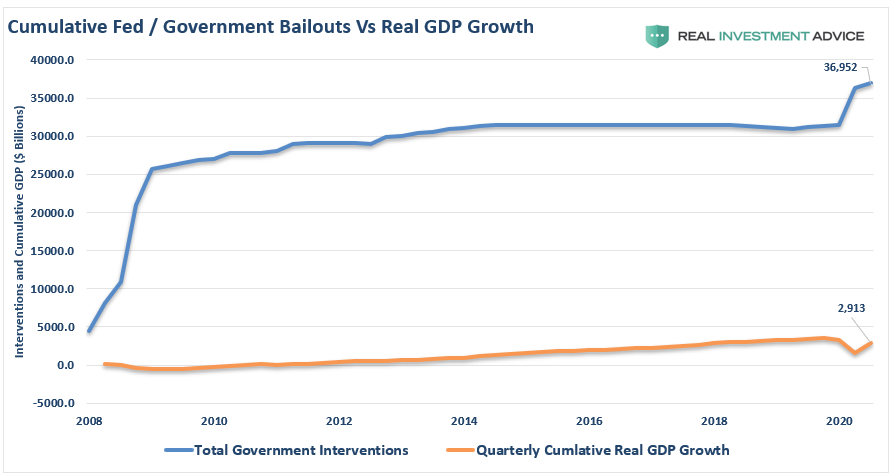
And a litany of “bailouts,” which are a function of increased debts and deficits and massive monetary interventions.
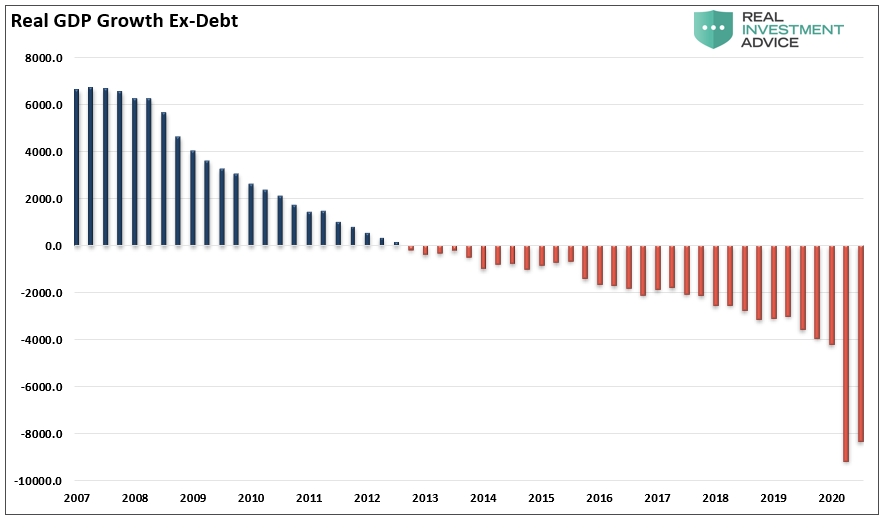
While the economy may have “appeared” to grow during this period, economic growth would have been “negative” without debt increases. The chart below shows what economic growth would be without the increases in Federal debt.
Such is why, after more than a decade of monetary and fiscal interventions totaling more than $37 Trillion and counting, the economy remains on “life support.”
(It required roughly $12 in support to generate $1 of economic growth.)
While the claims of a robust economy rely heavily upon a surge in consumer spending, it is a mirage of the increase in “social benefits.”
Real Incomes Not Improving
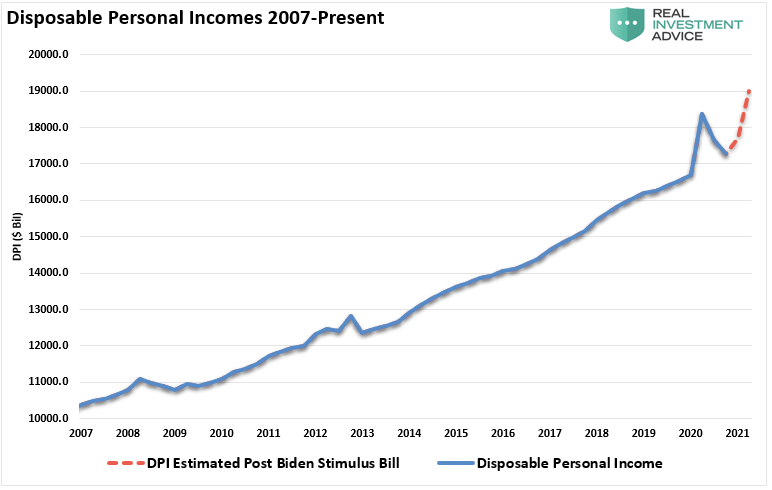
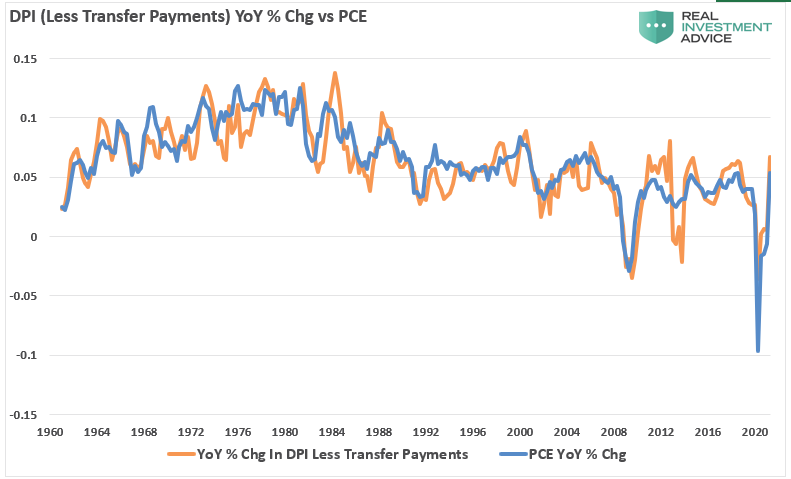
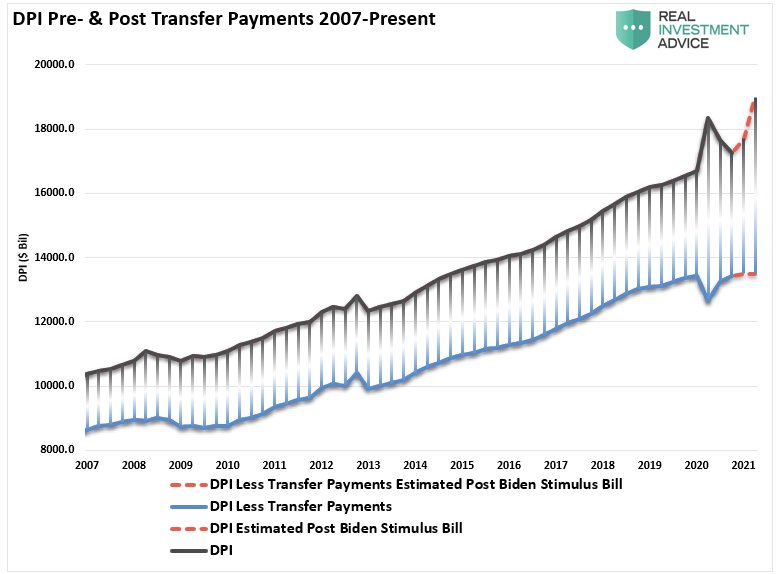
A significant problem with a bulk of the analysis put out by mainstream economists, and the media is that it often fails to examine the underlying causes. An excellent example has been that consumer incomes are surging, which will support the economic “sugar rush.” A look at the chart below would undoubtedly suggest that to be true.
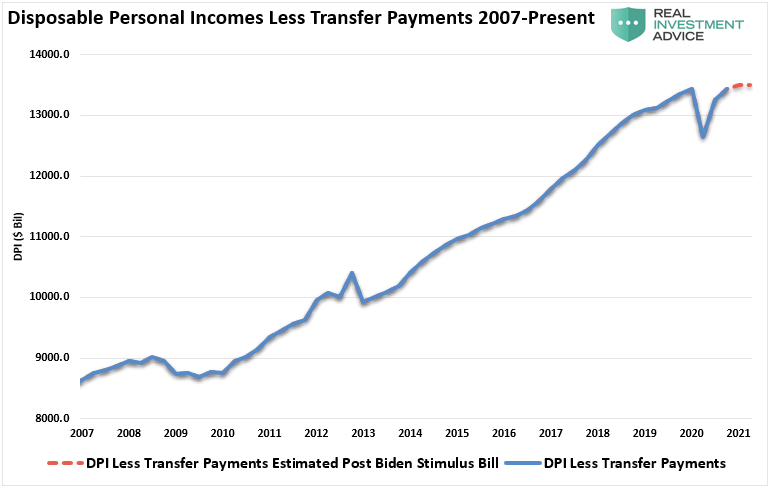
However, the reality is much less optimistic when you strip out “government transfer payments.” While the economy has rebounded, real disposable incomes remain below previous highs. Notably, of the next $1.9 trillion in stimulus, only roughly $900 billion flows to households. Such won’t boost incomes markedly.
The chart below shows the problem more clearly. As noted above, the “real” economic prosperity of household incomes has not improved markedly without government supports. Such is why, at roughly 2% economic growth, nearly 1-in-3 households are dependent on some form of government handout.
A Surge In The 'Welfare Trap'
There is a massive disconnect between the “stock market” and the “real economy.” As we have discussed previously, the top 10% of income earners own nearly 90% of the stock market.
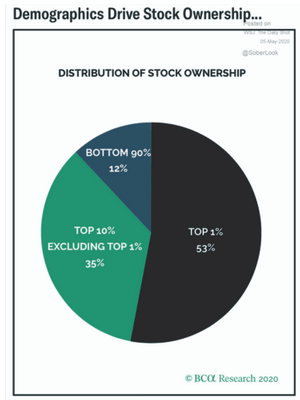
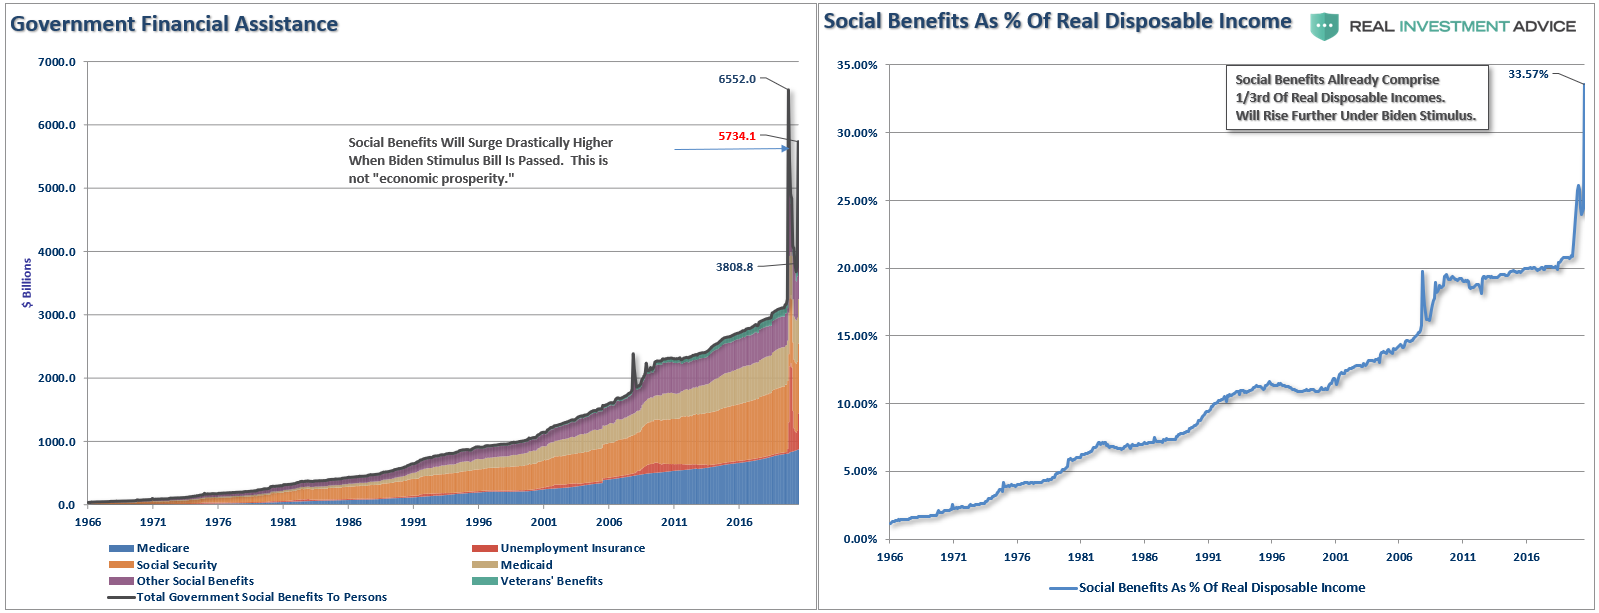
For the bottom 80%, which drives the bulk of personal consumption expenditures (PCE), they continue to struggle to make ends meet. Such is why the dependency on social welfare now comprises 1/3rd of total incomes. Other statistics are just as daunting.
- 38-million Americans on food stamps
- According to the Census Bureau, an estimated 50% of the 330 million Americans get at least one federal benefit.
- An estimated 63 million get Social Security; 59.9 million get Medicare; 75 million get Medicaid; 5 million get housing subsidies, and 4 million get Veterans’ benefits.
Those numbers continue to rise.
Without government largesse, many individuals would be living on the street. The chart above shows all the government “welfare” programs and current levels to date.
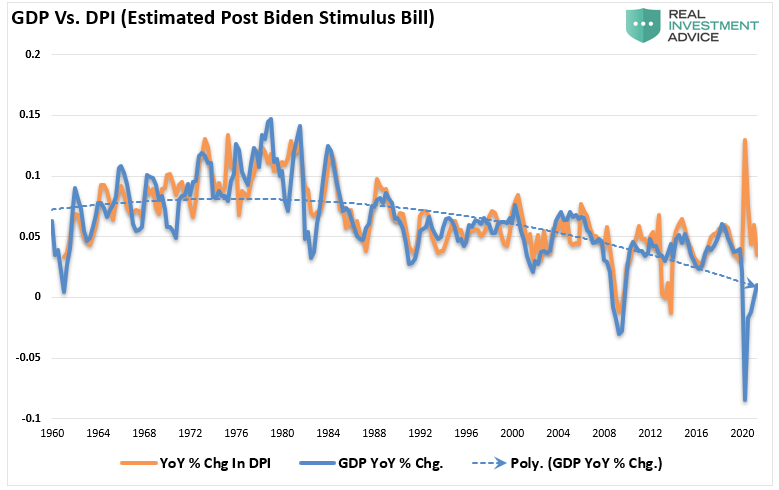
The problem with “stimulus programs” is that you can see the immediate subsequent contraction once the benefit depletes. Since 1/3rd of incomes dependent on government transfers, it is not surprising that the economy struggles as recycled tax dollars used for consumption purposes have virtually no impact on the overall economy.
In fact, in the ongoing saga of the American economy’s demise, U.S. households are now getting more in cash handouts from the government than they are paying in taxes for the first time since the Great Depression.
Such occurs when the current administration remains enthralled with finding some universe where socialistic programs lead to sustainable economic growth.
It doesn’t.
The Coming 'Crash'
As the stimulus hits consumers, they spend it rather quickly, which leads to a “sugar rush” of economic activity. Such as:
- Consumers use the funds to make either necessary or discretionary purchases creating demand.
- In anticipation of demand, companies boost “inventories.”
- The boost in “inventory stocking” boosts manufacturing metrics.
We are seeing this currently as manufacturing and inventory metrics surge.
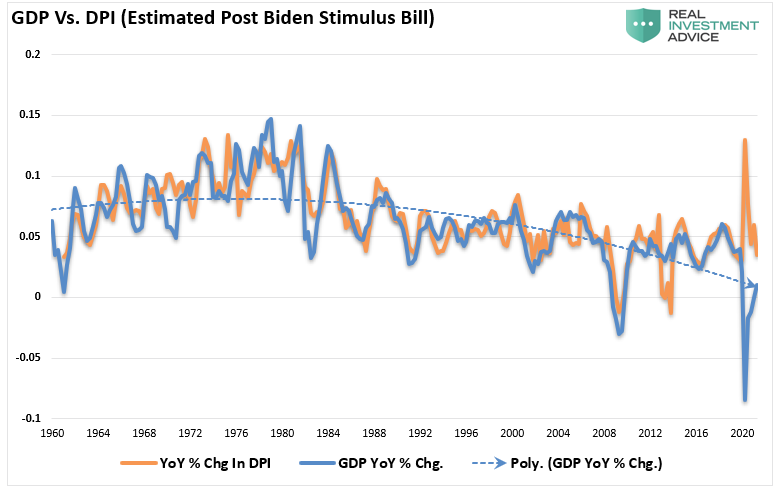
As shown, the stimulus will lead to a short-term boost in PCE, which will correspond with increased economic growth. (PCE comprises nearly 70% of the calculation.)
However, there is a “dark side” to stimulus-fueled activity.
- Since companies know the stimulus is “temporary,” they don’t make long-term hiring and capital expenditure plans.
- The increase in activity leads to an inflationary rise that companies have difficulty passing on to consumers, ultimately reducing profit margins.
- Again, since companies know the stimulus is temporary, they opt for “efficiencies,” such as outsourcing and automation, to lower labor and production costs.
- After the stimulus gets depleted, consumers struggle with higher costs which further deteriorates their standard of living.
Unless the Government is committed to a continuous stimulus, once the “sugar rush” fades, the economy will “crash” back to its organic state.
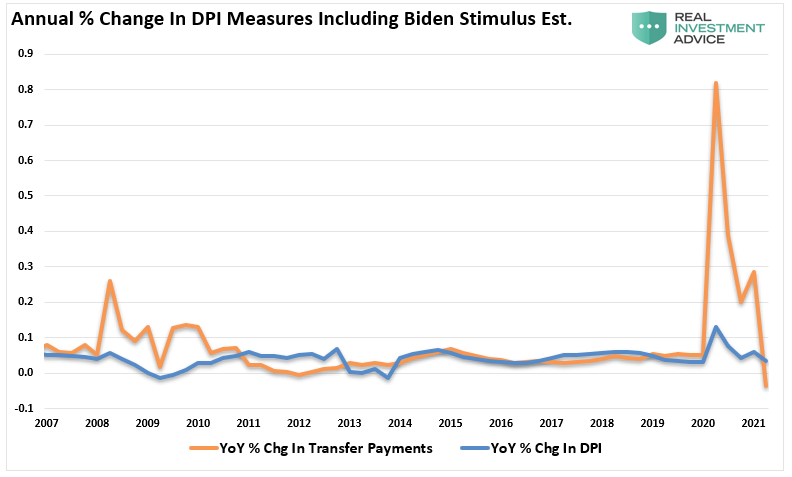
The bottom line is that America can’t grow its way back to prosperity on the back of social assistance. The average American is fighting to make ends meet as their living cost rises while wage growth remains stagnant.
Deflation Set To Return
That brings us to the hard truth.
If we assume even the most optimistic economic outcome of the current stimulus bill, the reality is that economic growth will remain mired in its long-term downtrend.
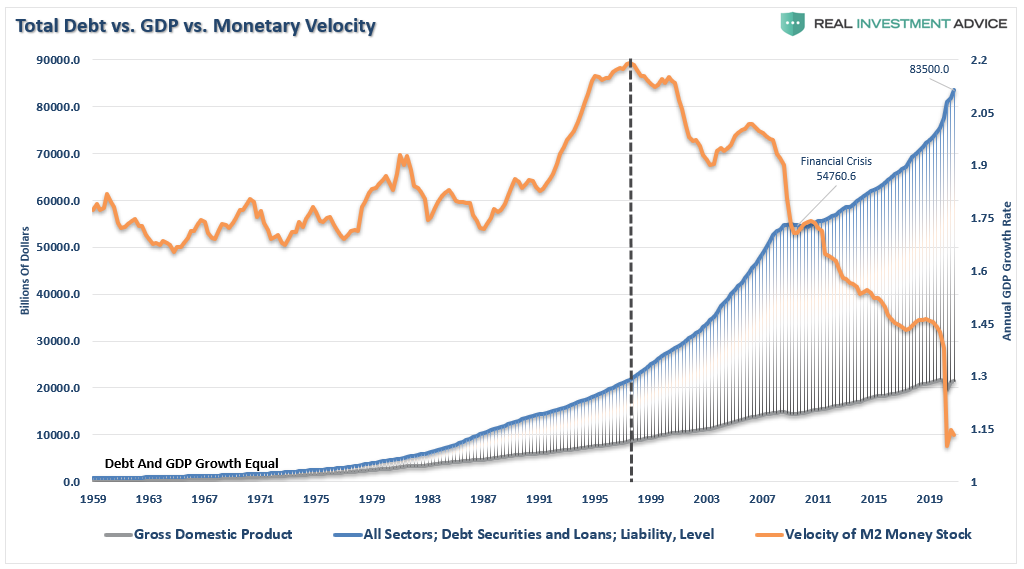
As the budget deficit grows over the next few years, interest payments alone will absorb a larger chunk of tax revenue. Such comes at a time when that same dollar of tax revenue only covers the entitlement spending of the 75-million baby boomers migrating into the social safety net.
By the way, the only other time government income support exceeded taxes paid was during the “Great Depression” from 1931 to 1936.
The debt problem remains a massive risk to monetary and fiscal policy. If rates rise, the negative impact on an indebted economy quickly depresses activity. More importantly, the decline in monetary velocity clearly shows that deflation is a persistent threat.
No Real Options
There are no real options unless the system is allowed to reset painfully.
Unfortunately, given we now have a decade of experience of watching monetary experiments only succeed in creating a massive “wealth gap,” maybe we should consider the alternative.
Ultimately, the Federal Reserve, and the Administration, will have to face hard choices to extricate the economy from the current “liquidity trap.” However, history shows that political leadership never makes hard choices until those choices get forced upon them.
Most telling is the current economists’ inability, who maintain our monetary and fiscal policies, to realize the problem of trying to “cure a debt problem with more debt.”
The Keynesian view that “more money in people’s pockets” will drive up consumer spending, with a boost to GDP being the result, has been wrong. It hasn’t happened in 40 years.
As Dr. Woody Brock aptly argues:
“It is truly ‘American Gridlock’ as the real crisis lies between the choices of ‘austerity’ and continued government ‘largesse.’ One choice leads to long-term economic prosperity for all; the other doesn’t.”
Take your pick.
While we likely see a spark of inflation, it probably won’t last long. Eventually, the grip of the debt-driven deflationary cycle will regain its burdensome hold.

