Let’s start this time out by establishing the premise:
Jay’s Trading Maxim #15a: The purpose of using an objective strategy is to remove emotion from trading decisions.
Which is important because of:
Jay’s Trading Maxim #25: Human nature is a detriment to trading and investment success and should be avoided as much as, well, humanly possible.
And let’s not forget:
Jay’s Trading Maxim #15b: The other purpose of using an objective strategy is NOT “to make money” (contrary to popular belief), but to “maximize the tradeoff between reward and risk.”
Which stems from:
Jay’s Trading Maxim #14: If you take on more risk than you can handle you will ultimately fail (sorry, I couldn’t figure out how to be any more blunt than that).
OK, I think that covers it.
The Indexes
So from here I am going to look at two strategies that require exactly zero thought to implement (other than of course remembering to make the requisite trades at the appropriate time which I’m pretty sure is why we now have alarms that we can set on our phones, but enough about me).
For our tests we will use index data. Since I am trying to make broad representations of the overall stock and bond markets – and because I want to go as far back with the data as possible – we will use
*Stocks = Wilshire 5000 Index
*Bonds = Barclays) Bloomberg Treasury Index
I have monthly total return data for these two indexes going back to January 1973. So roughly 45 years of history.
NOTE: Different indexes can easily be substituted including S&P 500 Index and a bond index that is more of an aggregate index including corporate bonds, etc. My guess is the results would be similar.
ANOTHER NOTE: The results that follow are based on a hypothetical test using index data and do not represent real-time, real world results. Also, note that no deductions are made for any fees, commissions, taxes, etc. The sole purpose is to compare the hypothetical raw results of one strategy versus another.
CYA complete, moving on.
1. The 60/40 Method
One of the simplest and most straightforward approaches to investing that many investors have adopted for over the years is to simply allocate a certain amount of capital to stocks and a certain amount to bonds, maybe readjust the allocation say once a year and let the markets do what they will.
And the bottom line is that this is not a bad strategy. It’s also maybe not a great strategy, but let’s not get ahead of ourselves. So for 60/40 we will do the following:
On December 31st of every calendar we will allocate:
*60% of the portfolio to the Wilshire 5000 Index
*40% of the portfolio to the Bloomberg Barclays Treasury Index
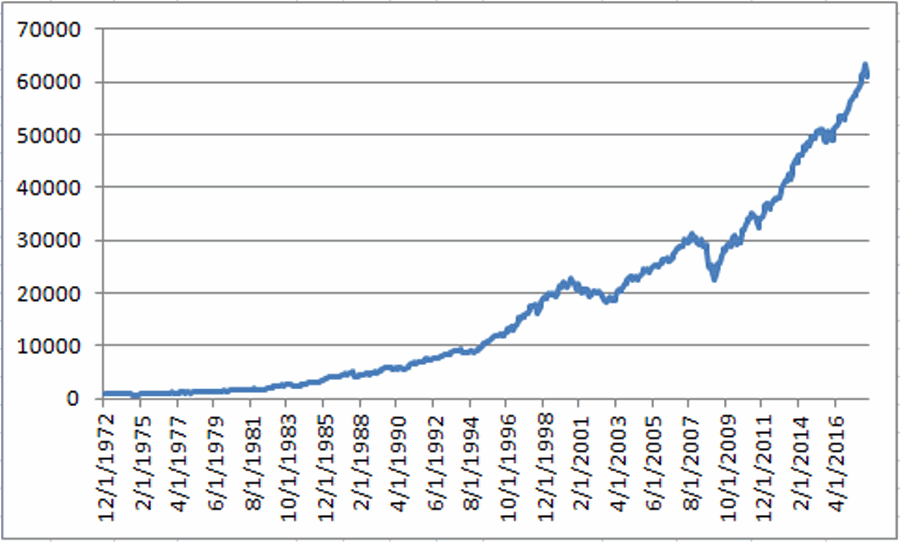
The equity curve from 12/31/1972 through 3/31/2018 appears in Figure 1.

Figure 1 – Growth of $1,000 using 60/40 Method; 12/31/1972-3/31/2018
2. The Sell in May Method
This strategy works as follows:
*On May 31st sell the Wilshire 5000 Index and buy the Barclays Bloomberg Treasury Index
*On October 31st sell the Barclays Bloomberg Treasury Index and buy the Wilshire 5000 Index
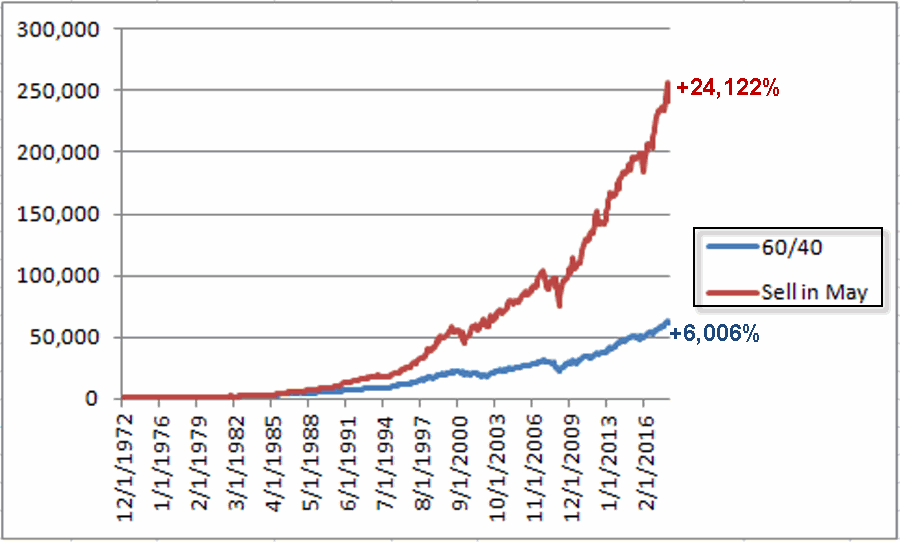
Figure 2 displays the equity curve for “Sell in May” in red and the equity curve for “60/40” (copied from Figure 1) in blue.

Figure 2 – Growth of $1,000 Sell in May (red line) versus 60/40 Method (blue line); 12/31/1972-3/31/2018
Anything jump out at you?
Clearly the “Sell in May” approach made more money than the “60/40” approach. But remember, our objective is NOT “to make money” but to “maximize the trade-off between reward and risk.” In other words, if the volatility of the equity swings of “Sell in May” are so great that one cannot maintain the discipline to continue trading it, then the higher returns may only be illusory. So let’s “go to the numbers.”

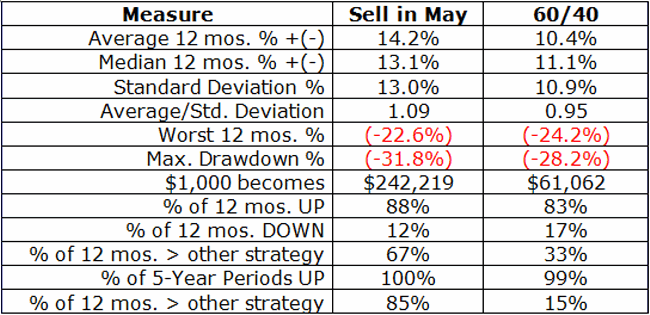
Figure 3 – Relative Performance Figures: Sell in May vs. 60/40; 12/31/1972-3/31/2018
A few things to note in Figure 3 – The 60/40 approach:
*Made money in 83% of all 12-month periods and 99% of all 5-year periods
*It has a respectable 12-month average and median gain (+10.4% and +11.1%, respectively)
*It also has a lower annual standard deviation (10.9%) and lower maximum drawdown (-28.0%) than the Sell in May Method.
*For the record, 60/40 performance and Sell in May performance was roughly equal through about 1982.
So all in all a very respectable performance and decent strategy.
The Sell in May Method, on the other hand, clearly made more money on a more consistent basis (at least since 1982):
*An average gain of +14.2% and an average gain/standard deviation above 1.00 (1.09)
*A Maximum Drawdown of -31.8% is nothing to slough off, but in this test it is not that much greater than the maximum drawdown for the 60/40 Method
*It made money in 88% of all 12-month periods and 100% of all 5-year periods
*Sell in May outperformed 60/40 during 2/3rds of all 12-month periods and during 85% of all 5-year periods.
Summary
So can I state categorically that Sell in May is superior to 60/40? That’s not my job here. The information presented on this blog is for “educational purposes only.”
Hence, I leave you the reader to draw your own conclusions.
Disclaimer: The data presented herein were obtained from various third-party sources. While I believe the data to be reliable, no representation is made as to, and no responsibility, warranty or liability is accepted for the accuracy or completeness of such information. The information, opinions and ideas expressed herein are for informational and educational purposes only and do not constitute and should not be construed as investment advice, an advertisement or offering of investment advisory services, or an offer to sell or a solicitation to buy any security.
