
Stratasys Ltd. (NASDAQ:SSYS) reported fourth-quarter 2018 earnings of 21 cents per share, which matched the Zacks Consensus Estimate. The figure was higher than the year-ago figure of 16 cents.
However, Stratasys’ revenues of $177.1 million missed the consensus estimate of $187 million, and also lagged the year-ago figure by 1.2%.
Strength in sales of high-end system and materials for PolyJet and FDM technology platforms, especially in North America aided the top line. However, the U.S. government shutdown and weakness in the Automotive sector in Europe affected the results.
Quarter Details
Segment wise, Products revenues fell 4.1% from the year-ago quarter to $124.5 million. This figure was down 1.6%, excluding the divested businesses.
Within Products revenues, System revenues decreased 6.9%. Taking the divestiture into account, the figure fell 4%. Consumables revenues remained flat year over year but were up 1.3% excluding divestiture, driven by strength in demand in the United States.
Revenues from Services increased 6.1% year over year to $52.6 million. The rise was primarily attributed to 6.2% growth in customer support revenues and improvement in performance at Stratasys Direct Manufacturing.
Stratasys’ J750 and J735 full color 3D printers are witnessing strong demand in CPG segment. This segment offers significant opportunities for the company within the prototyping space.
Further, the company’s manufacturing business showed strength, driven by strong adoption of the S900 series and advanced materials.
Also, Stratasys’ efforts in collaboration with aerospace OEMs started reaping benefits as numerous FDM production parts were deployed.
Margin
Stratasys’ non-GAAP gross profit decreased 1.7% from the year-ago quarter to $92.5 million. Non-GAAP gross margin fell 30 basis points (bps) to 52.2% due to the product mix.
Non-GAAP operating income totaled $12.8 million, down 5.2% from the year-ago quarter. Operating margin declined 30 bps to 7.2%.
Balance Sheet and Cash Flow
The company exited the quarter with cash and cash equivalents of $393.2 million compared with $348.9 million at the end of the previous quarter.
As of Dec 31, 2018, long-term debt came in at $22 million.
Net cash provided by operating activities in the quarter was $18.7 million.
Full-Year Highlights
For the full year of 2018, revenues came in at $663.2 million compared with $668.4 million in 2017.
Non-GAAP operating income was $36.5 million, down 0.5% year over year.
Non-GAAP earnings per share were 52 cents, down from 45 cents reported a year ago.
Guidance
For full-year 2019, the company provided revenue guidance in the range of $670-$700 million.
Non-GAAP earnings per share for the full year is expected between 55 cents and 70 cents.
Non-GAAP operating margin is expected to be in the 5.5-6.5% band.
Capital expenditures are estimated to lie within $45-$60 million.
Management is optimistic about its product lineup, which is expected to expand its addressable markets, resulting in accelerated growth from 2020.
Stratasys, Ltd. Price, Consensus and EPS Surprise
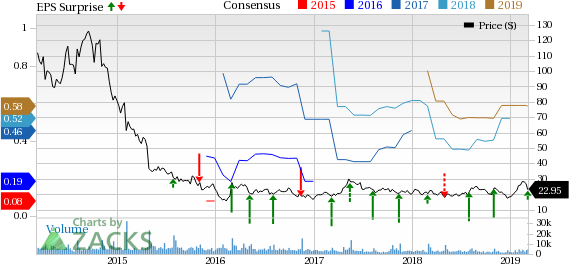
Stratasys, Ltd. Price, Consensus and EPS Surprise | Stratasys, Ltd. Quote
Stocks to Consider
A few stocks worth considering in the broader Computer and Technology sector are Fortinet, Inc. (NASDAQ:FTNT) , Synopsys, Inc. (NASDAQ:SNPS) and eGain Corporation (NASDAQ:EGAN) , each sporting a Zacks Rank #1 (Strong Buy). You can see the complete list of today’s Zacks #1 Rank stocks here.
Long-term earnings growth for Fortinet, Synopsys and eGain is projected to be 16.75%, 10% and 30%, respectively.
Today's Best Stocks from Zacks
Would you like to see the updated picks from our best market-beating strategies? From 2017 through 2018, while the S&P 500 gained +15.8%, five of our screens returned +38.0%, +61.3%, +61.6%, +68.1%, and +98.3%.
This outperformance has not just been a recent phenomenon. From 2000 – 2018, while the S&P averaged +4.8% per year, our top strategies averaged up to +56.2% per year.
See their latest picks free >>
Fortinet, Inc. (FTNT): Free Stock Analysis Report
eGain Corporation (EGAN): Free Stock Analysis Report
Synopsys, Inc. (SNPS): Free Stock Analysis Report
Stratasys, Ltd. (SSYS): Free Stock Analysis Report
Original post
Zacks Investment Research